Rhizobium tumorigenes
Taxonomy: cellular organisms; Bacteria; Proteobacteria; Alphaproteobacteria; Hyphomicrobiales; Rhizobiaceae; Rhizobium/Agrobacterium group; Rhizobium
Average proteome isoelectric point is 6.48
Get precalculated fractions of proteins
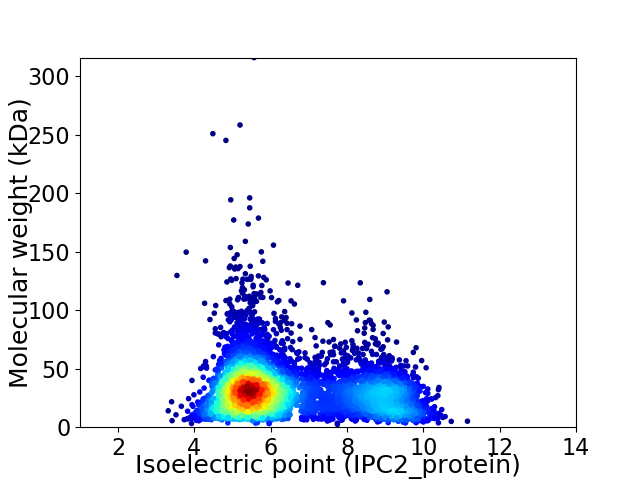
Virtual 2D-PAGE plot for 5385 proteins (isoelectric point calculated using IPC2_protein)
Get csv file with sequences according to given criteria:
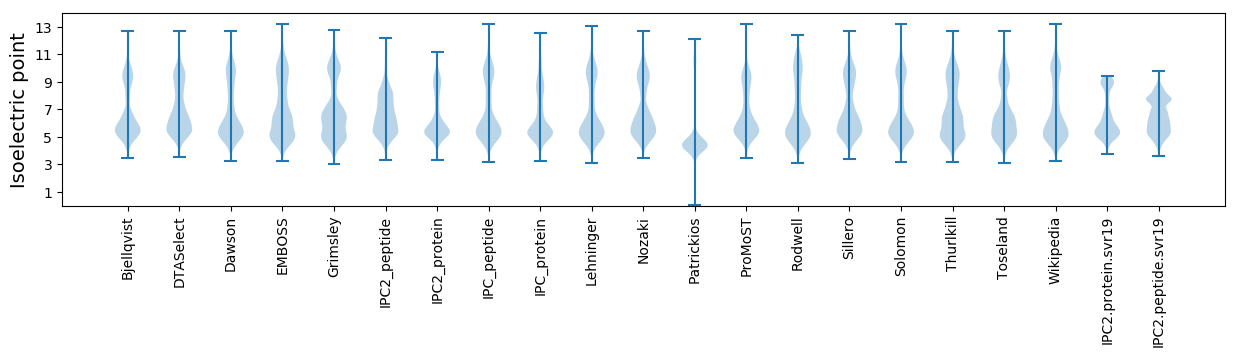
* You can choose from 21 different methods for calculating isoelectric point
Summary statistics related to proteome-wise predictions
Protein with the lowest isoelectric point:
>tr|A0A2W4BV51|A0A2W4BV51_9RHIZ Uncharacterized protein OS=Rhizobium tumorigenes OX=2041385 GN=CPJ17_02720 PE=4 SV=1
MM1 pKa = 7.86SDD3 pKa = 3.76LSLAQNHH10 pKa = 6.17AFDD13 pKa = 4.45LARR16 pKa = 11.84TLMVPVTLFEE26 pKa = 5.21IDD28 pKa = 3.61GEE30 pKa = 4.23IGVMISAEE38 pKa = 3.99YY39 pKa = 10.81DD40 pKa = 3.26GDD42 pKa = 3.41EE43 pKa = 4.18DD44 pKa = 5.87AIINIYY50 pKa = 10.9DD51 pKa = 3.6PFAYY55 pKa = 10.1GSAHH59 pKa = 6.27
MM1 pKa = 7.86SDD3 pKa = 3.76LSLAQNHH10 pKa = 6.17AFDD13 pKa = 4.45LARR16 pKa = 11.84TLMVPVTLFEE26 pKa = 5.21IDD28 pKa = 3.61GEE30 pKa = 4.23IGVMISAEE38 pKa = 3.99YY39 pKa = 10.81DD40 pKa = 3.26GDD42 pKa = 3.41EE43 pKa = 4.18DD44 pKa = 5.87AIINIYY50 pKa = 10.9DD51 pKa = 3.6PFAYY55 pKa = 10.1GSAHH59 pKa = 6.27
Molecular weight: 6.46 kDa
Isoelectric point according different methods:
Protein with the highest isoelectric point:
>tr|A0A2W4BVU9|A0A2W4BVU9_9RHIZ GntR family transcriptional regulator OS=Rhizobium tumorigenes OX=2041385 GN=CPJ17_07985 PE=4 SV=1
MM1 pKa = 7.35KK2 pKa = 9.43RR3 pKa = 11.84TYY5 pKa = 10.27QPSKK9 pKa = 9.43LVRR12 pKa = 11.84ARR14 pKa = 11.84RR15 pKa = 11.84HH16 pKa = 4.38GFRR19 pKa = 11.84ARR21 pKa = 11.84MATKK25 pKa = 10.22GGRR28 pKa = 11.84KK29 pKa = 9.48VIIARR34 pKa = 11.84RR35 pKa = 11.84GRR37 pKa = 11.84GRR39 pKa = 11.84KK40 pKa = 9.08RR41 pKa = 11.84LSAA44 pKa = 4.03
MM1 pKa = 7.35KK2 pKa = 9.43RR3 pKa = 11.84TYY5 pKa = 10.27QPSKK9 pKa = 9.43LVRR12 pKa = 11.84ARR14 pKa = 11.84RR15 pKa = 11.84HH16 pKa = 4.38GFRR19 pKa = 11.84ARR21 pKa = 11.84MATKK25 pKa = 10.22GGRR28 pKa = 11.84KK29 pKa = 9.48VIIARR34 pKa = 11.84RR35 pKa = 11.84GRR37 pKa = 11.84GRR39 pKa = 11.84KK40 pKa = 9.08RR41 pKa = 11.84LSAA44 pKa = 4.03
Molecular weight: 5.14 kDa
Isoelectric point according different methods:
Peptides (in silico digests for buttom-up proteomics)
Below you can find in silico digests of the whole proteome with Trypsin, Chymotrypsin, Trypsin+LysC, LysN, ArgC proteases suitable for different mass spec machines.| Try ESI |
 |
|---|
| ChTry ESI |
|
|---|
| ArgC ESI |
|
|---|
| LysN ESI |
|
|---|
| TryLysC ESI |
|
|---|
| Try MALDI |
|
|---|
| ChTry MALDI |
|
|---|
| ArgC MALDI |
|
|---|
| LysN MALDI |
|
|---|
| TryLysC MALDI |
|
|---|
| Try LTQ |
|
|---|
| ChTry LTQ |
|
|---|
| ArgC LTQ |
|
|---|
| LysN LTQ |
|
|---|
| TryLysC LTQ |
|
|---|
| Try MSlow |
|
|---|
| ChTry MSlow |
|
|---|
| ArgC MSlow |
|
|---|
| LysN MSlow |
|
|---|
| TryLysC MSlow |
|
|---|
| Try MShigh |
|
|---|
| ChTry MShigh |
|
|---|
| ArgC MShigh |
|
|---|
| LysN MShigh |
|
|---|
| TryLysC MShigh |
|
|---|
General Statistics
Number of major isoforms |
Number of additional isoforms |
Number of all proteins |
Number of amino acids |
Min. Seq. Length |
Max. Seq. Length |
Avg. Seq. Length |
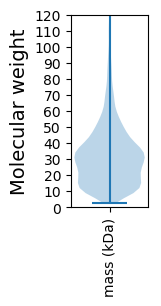
Avg. Mol. Weight |
|---|---|---|---|---|---|---|---|
0 |
1661158 |
26 |
2833 |
308.5 |
33.54 |
Amino acid frequency
Ala |
Cys |
Asp |
Glu |
Phe |
Gly |
His |
Ile |
Lys |
Leu |
|---|---|---|---|---|---|---|---|---|---|
11.724 ± 0.04 | 0.807 ± 0.01 |
5.851 ± 0.023 | 5.411 ± 0.034 |
3.888 ± 0.022 | 8.248 ± 0.033 |
2.037 ± 0.015 | 5.774 ± 0.026 |
3.699 ± 0.026 | 9.939 ± 0.035 |
Met |
Asn |
Gln |
Pro |
Arg |
Ser |
Thr |
Val |
Trp |
Tyr |
|---|---|---|---|---|---|---|---|---|---|
2.631 ± 0.014 | 2.875 ± 0.019 |
4.853 ± 0.029 | 3.184 ± 0.018 |
6.543 ± 0.033 | 6.101 ± 0.033 |
5.501 ± 0.024 | 7.373 ± 0.027 |
1.266 ± 0.013 | 2.295 ± 0.018 |
Most of the basic statistics you can see at this page can be downloaded from this CSV file
See this proteome in:

Proteome-pI is available under Creative Commons Attribution-NoDerivs license, for more details see here
| Reference: Kozlowski LP. Proteome-pI 2.0: Proteome Isoelectric Point Database Update. Nucleic Acids Res. 2021, doi: 10.1093/nar/gkab944 | Contact: Lukasz P. Kozlowski |