Fusobacterium varium ATCC 27725
Taxonomy: cellular organisms; Bacteria; Fusobacteria; Fusobacteriia; Fusobacteriales; Fusobacteriaceae; Fusobacterium; Fusobacterium varium
Average proteome isoelectric point is 6.72
Get precalculated fractions of proteins
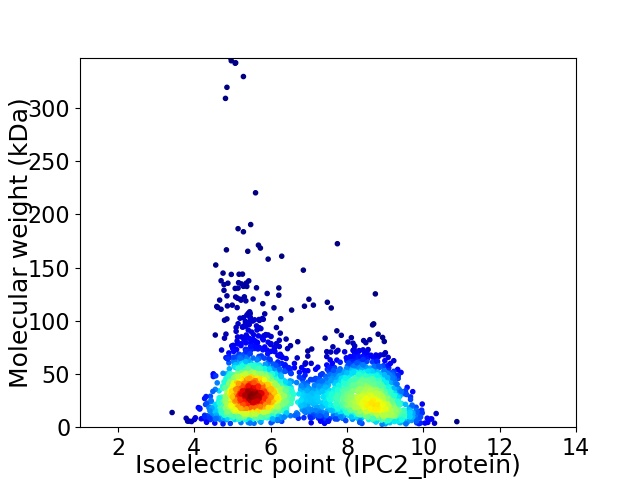
Virtual 2D-PAGE plot for 3007 proteins (isoelectric point calculated using IPC2_protein)
Get csv file with sequences according to given criteria:
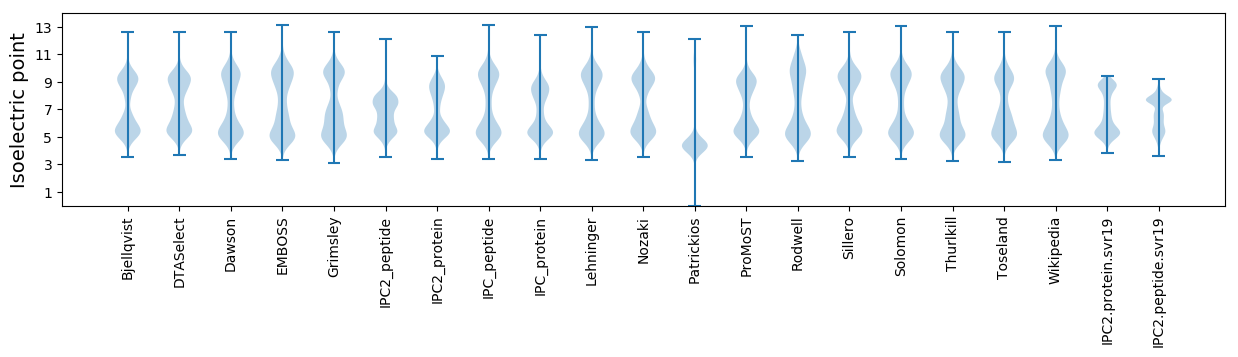
* You can choose from 21 different methods for calculating isoelectric point
Summary statistics related to proteome-wise predictions
Protein with the lowest isoelectric point:
>tr|C6JMC7|C6JMC7_FUSVA 1 3-propanediol dehydrogenase OS=Fusobacterium varium ATCC 27725 OX=469618 GN=dhaT PE=4 SV=1
MM1 pKa = 7.57KK2 pKa = 10.17KK3 pKa = 10.21YY4 pKa = 8.9EE5 pKa = 4.54CKK7 pKa = 9.7VCGYY11 pKa = 10.05IYY13 pKa = 10.52DD14 pKa = 4.17PVEE17 pKa = 4.35GDD19 pKa = 3.85PDD21 pKa = 3.87SGIAPGTAFEE31 pKa = 5.97DD32 pKa = 4.28IPDD35 pKa = 3.74DD36 pKa = 4.06WVCPLCGVGKK46 pKa = 10.32DD47 pKa = 3.59DD48 pKa = 5.59FEE50 pKa = 6.9AII52 pKa = 3.94
MM1 pKa = 7.57KK2 pKa = 10.17KK3 pKa = 10.21YY4 pKa = 8.9EE5 pKa = 4.54CKK7 pKa = 9.7VCGYY11 pKa = 10.05IYY13 pKa = 10.52DD14 pKa = 4.17PVEE17 pKa = 4.35GDD19 pKa = 3.85PDD21 pKa = 3.87SGIAPGTAFEE31 pKa = 5.97DD32 pKa = 4.28IPDD35 pKa = 3.74DD36 pKa = 4.06WVCPLCGVGKK46 pKa = 10.32DD47 pKa = 3.59DD48 pKa = 5.59FEE50 pKa = 6.9AII52 pKa = 3.94
Molecular weight: 5.67 kDa
Isoelectric point according different methods:
Protein with the highest isoelectric point:
>tr|C6JLE6|C6JLE6_FUSVA S4 domain protein YaaA OS=Fusobacterium varium ATCC 27725 OX=469618 GN=yaaA PE=4 SV=1
MM1 pKa = 7.44KK2 pKa = 9.59RR3 pKa = 11.84TFQPNKK9 pKa = 9.63AKK11 pKa = 10.38RR12 pKa = 11.84KK13 pKa = 8.12KK14 pKa = 10.21DD15 pKa = 3.02HH16 pKa = 6.3GFRR19 pKa = 11.84ARR21 pKa = 11.84MATKK25 pKa = 10.42NGRR28 pKa = 11.84KK29 pKa = 7.92VLKK32 pKa = 9.96RR33 pKa = 11.84RR34 pKa = 11.84RR35 pKa = 11.84ARR37 pKa = 11.84GRR39 pKa = 11.84QVLSAA44 pKa = 4.26
MM1 pKa = 7.44KK2 pKa = 9.59RR3 pKa = 11.84TFQPNKK9 pKa = 9.63AKK11 pKa = 10.38RR12 pKa = 11.84KK13 pKa = 8.12KK14 pKa = 10.21DD15 pKa = 3.02HH16 pKa = 6.3GFRR19 pKa = 11.84ARR21 pKa = 11.84MATKK25 pKa = 10.42NGRR28 pKa = 11.84KK29 pKa = 7.92VLKK32 pKa = 9.96RR33 pKa = 11.84RR34 pKa = 11.84RR35 pKa = 11.84ARR37 pKa = 11.84GRR39 pKa = 11.84QVLSAA44 pKa = 4.26
Molecular weight: 5.24 kDa
Isoelectric point according different methods:
Peptides (in silico digests for buttom-up proteomics)
Below you can find in silico digests of the whole proteome with Trypsin, Chymotrypsin, Trypsin+LysC, LysN, ArgC proteases suitable for different mass spec machines.| Try ESI |
 |
|---|
| ChTry ESI |
|
|---|
| ArgC ESI |
|
|---|
| LysN ESI |
|
|---|
| TryLysC ESI |
|
|---|
| Try MALDI |
|
|---|
| ChTry MALDI |
|
|---|
| ArgC MALDI |
|
|---|
| LysN MALDI |
|
|---|
| TryLysC MALDI |
|
|---|
| Try LTQ |
|
|---|
| ChTry LTQ |
|
|---|
| ArgC LTQ |
|
|---|
| LysN LTQ |
|
|---|
| TryLysC LTQ |
|
|---|
| Try MSlow |
|
|---|
| ChTry MSlow |
|
|---|
| ArgC MSlow |
|
|---|
| LysN MSlow |
|
|---|
| TryLysC MSlow |
|
|---|
| Try MShigh |
|
|---|
| ChTry MShigh |
|
|---|
| ArgC MShigh |
|
|---|
| LysN MShigh |
|
|---|
| TryLysC MShigh |
|
|---|
General Statistics
Number of major isoforms |
Number of additional isoforms |
Number of all proteins |
Number of amino acids |
Min. Seq. Length |
Max. Seq. Length |
Avg. Seq. Length |
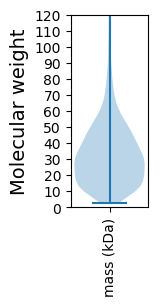
Avg. Mol. Weight |
|---|---|---|---|---|---|---|---|
0 |
949191 |
25 |
3391 |
315.7 |
35.57 |
Amino acid frequency
Ala |
Cys |
Asp |
Glu |
Phe |
Gly |
His |
Ile |
Lys |
Leu |
|---|---|---|---|---|---|---|---|---|---|
5.796 ± 0.052 | 0.908 ± 0.017 |
5.054 ± 0.038 | 7.941 ± 0.071 |
4.709 ± 0.054 | 7.234 ± 0.091 |
1.232 ± 0.019 | 9.919 ± 0.059 |
9.487 ± 0.058 | 8.921 ± 0.06 |
Met |
Asn |
Gln |
Pro |
Arg |
Ser |
Thr |
Val |
Trp |
Tyr |
|---|---|---|---|---|---|---|---|---|---|
2.72 ± 0.026 | 5.932 ± 0.067 |
2.723 ± 0.03 | 2.046 ± 0.02 |
3.292 ± 0.035 | 5.873 ± 0.041 |
5.12 ± 0.067 | 6.256 ± 0.043 |
0.663 ± 0.012 | 4.173 ± 0.035 |
Most of the basic statistics you can see at this page can be downloaded from this CSV file
See this proteome in:

Proteome-pI is available under Creative Commons Attribution-NoDerivs license, for more details see here
| Reference: Kozlowski LP. Proteome-pI 2.0: Proteome Isoelectric Point Database Update. Nucleic Acids Res. 2021, doi: 10.1093/nar/gkab944 | Contact: Lukasz P. Kozlowski |