Pseudomonas phage PA10
Taxonomy: Viruses; Duplodnaviria; Heunggongvirae; Uroviricota; Caudoviricetes; Caudovirales; Myoviridae; Pakpunavirus; Pseudomonas virus PA10
Average proteome isoelectric point is 5.96
Get precalculated fractions of proteins
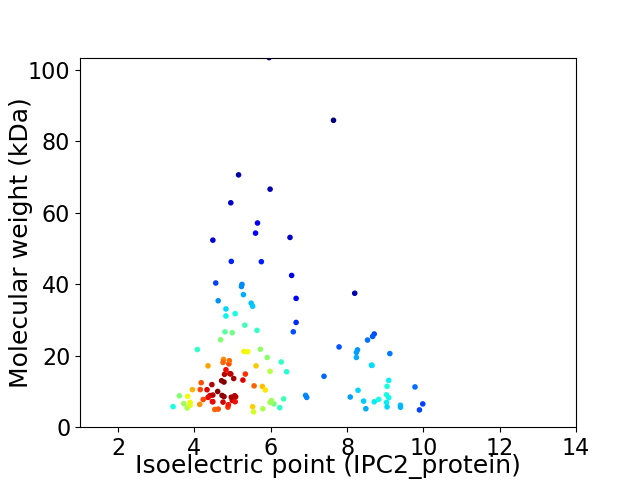
Virtual 2D-PAGE plot for 127 proteins (isoelectric point calculated using IPC2_protein)
Get csv file with sequences according to given criteria:
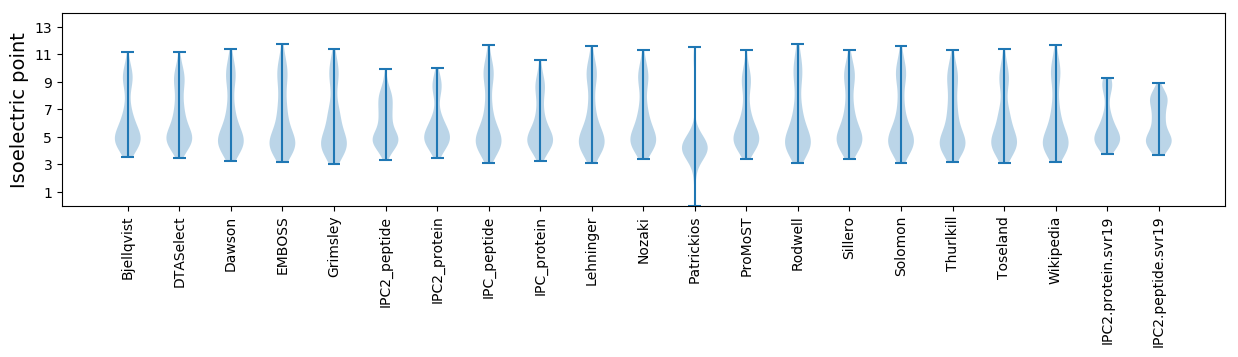
* You can choose from 21 different methods for calculating isoelectric point
Summary statistics related to proteome-wise predictions
Protein with the lowest isoelectric point:
>tr|A0A1J0MI46|A0A1J0MI46_9CAUD Uncharacterized protein OS=Pseudomonas phage PA10 OX=1913575 PE=4 SV=1
MM1 pKa = 7.17TVYY4 pKa = 10.7KK5 pKa = 9.65FWCEE9 pKa = 2.9WDD11 pKa = 2.89IGINEE16 pKa = 4.26FLWRR20 pKa = 11.84DD21 pKa = 3.72YY22 pKa = 11.34YY23 pKa = 11.62QMEE26 pKa = 4.3EE27 pKa = 4.29DD28 pKa = 3.65VAKK31 pKa = 10.66ALSDD35 pKa = 3.75CGIEE39 pKa = 4.0DD40 pKa = 4.09TIEE43 pKa = 4.01EE44 pKa = 4.43LEE46 pKa = 4.31GAGLLGFDD54 pKa = 3.72SVKK57 pKa = 10.98VIGG60 pKa = 4.11
MM1 pKa = 7.17TVYY4 pKa = 10.7KK5 pKa = 9.65FWCEE9 pKa = 2.9WDD11 pKa = 2.89IGINEE16 pKa = 4.26FLWRR20 pKa = 11.84DD21 pKa = 3.72YY22 pKa = 11.34YY23 pKa = 11.62QMEE26 pKa = 4.3EE27 pKa = 4.29DD28 pKa = 3.65VAKK31 pKa = 10.66ALSDD35 pKa = 3.75CGIEE39 pKa = 4.0DD40 pKa = 4.09TIEE43 pKa = 4.01EE44 pKa = 4.43LEE46 pKa = 4.31GAGLLGFDD54 pKa = 3.72SVKK57 pKa = 10.98VIGG60 pKa = 4.11
Molecular weight: 6.94 kDa
Isoelectric point according different methods:
Protein with the highest isoelectric point:
>tr|A0A1J0MI67|A0A1J0MI67_9CAUD Uncharacterized protein OS=Pseudomonas phage PA10 OX=1913575 PE=4 SV=1
MM1 pKa = 7.32KK2 pKa = 10.22RR3 pKa = 11.84QYY5 pKa = 10.12TDD7 pKa = 3.11SYY9 pKa = 9.11QCKK12 pKa = 10.24AIDD15 pKa = 4.02GLMSICGGKK24 pKa = 9.6KK25 pKa = 10.25AIVQVWPSLKK35 pKa = 10.09ASRR38 pKa = 11.84NRR40 pKa = 11.84RR41 pKa = 11.84LKK43 pKa = 11.17KK44 pKa = 8.32MIKK47 pKa = 9.82YY48 pKa = 9.43IARR51 pKa = 11.84SGWRR55 pKa = 11.84PP56 pKa = 2.99
MM1 pKa = 7.32KK2 pKa = 10.22RR3 pKa = 11.84QYY5 pKa = 10.12TDD7 pKa = 3.11SYY9 pKa = 9.11QCKK12 pKa = 10.24AIDD15 pKa = 4.02GLMSICGGKK24 pKa = 9.6KK25 pKa = 10.25AIVQVWPSLKK35 pKa = 10.09ASRR38 pKa = 11.84NRR40 pKa = 11.84RR41 pKa = 11.84LKK43 pKa = 11.17KK44 pKa = 8.32MIKK47 pKa = 9.82YY48 pKa = 9.43IARR51 pKa = 11.84SGWRR55 pKa = 11.84PP56 pKa = 2.99
Molecular weight: 6.52 kDa
Isoelectric point according different methods:
Peptides (in silico digests for buttom-up proteomics)
Below you can find in silico digests of the whole proteome with Trypsin, Chymotrypsin, Trypsin+LysC, LysN, ArgC proteases suitable for different mass spec machines.| Try ESI |
 |
|---|
| ChTry ESI |
|
|---|
| ArgC ESI |
|
|---|
| LysN ESI |
|
|---|
| TryLysC ESI |
|
|---|
| Try MALDI |
|
|---|
| ChTry MALDI |
|
|---|
| ArgC MALDI |
|
|---|
| LysN MALDI |
|
|---|
| TryLysC MALDI |
|
|---|
| Try LTQ |
|
|---|
| ChTry LTQ |
|
|---|
| ArgC LTQ |
|
|---|
| LysN LTQ |
|
|---|
| TryLysC LTQ |
|
|---|
| Try MSlow |
|
|---|
| ChTry MSlow |
|
|---|
| ArgC MSlow |
|
|---|
| LysN MSlow |
|
|---|
| TryLysC MSlow |
|
|---|
| Try MShigh |
|
|---|
| ChTry MShigh |
|
|---|
| ArgC MShigh |
|
|---|
| LysN MShigh |
|
|---|
| TryLysC MShigh |
|
|---|
General Statistics
Number of major isoforms |
Number of additional isoforms |
Number of all proteins |
Number of amino acids |
Min. Seq. Length |
Max. Seq. Length |
Avg. Seq. Length |
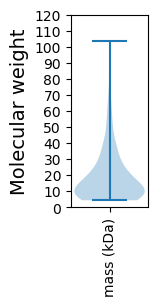
Avg. Mol. Weight |
|---|---|---|---|---|---|---|---|
0 |
21903 |
37 |
904 |
172.5 |
19.46 |
Amino acid frequency
Ala |
Cys |
Asp |
Glu |
Phe |
Gly |
His |
Ile |
Lys |
Leu |
|---|---|---|---|---|---|---|---|---|---|
7.967 ± 0.319 | 1.292 ± 0.112 |
6.364 ± 0.159 | 7.876 ± 0.307 |
4.2 ± 0.143 | 7.072 ± 0.257 |
1.927 ± 0.129 | 5.41 ± 0.189 |
6.469 ± 0.245 | 7.766 ± 0.175 |
Met |
Asn |
Gln |
Pro |
Arg |
Ser |
Thr |
Val |
Trp |
Tyr |
|---|---|---|---|---|---|---|---|---|---|
3.022 ± 0.118 | 4.246 ± 0.181 |
3.607 ± 0.166 | 3.557 ± 0.142 |
5.419 ± 0.201 | 5.73 ± 0.203 |
5.447 ± 0.229 | 7.273 ± 0.245 |
1.689 ± 0.111 | 3.666 ± 0.161 |
Most of the basic statistics you can see at this page can be downloaded from this CSV file
See this proteome in:

Proteome-pI is available under Creative Commons Attribution-NoDerivs license, for more details see here
| Reference: Kozlowski LP. Proteome-pI 2.0: Proteome Isoelectric Point Database Update. Nucleic Acids Res. 2021, doi: 10.1093/nar/gkab944 | Contact: Lukasz P. Kozlowski |