Ktedonobacter racemifer DSM 44963
Taxonomy: cellular organisms; Bacteria; Terrabacteria group; Chloroflexi; Ktedonobacteria; Ktedonobacterales; Ktedonobacteraceae; Ktedonobacter; Ktedonobacter racemifer
Average proteome isoelectric point is 6.72
Get precalculated fractions of proteins
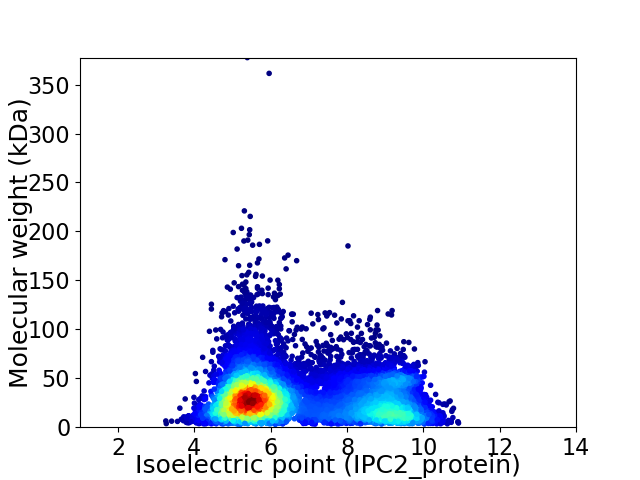
Virtual 2D-PAGE plot for 11211 proteins (isoelectric point calculated using IPC2_protein)
Get csv file with sequences according to given criteria:
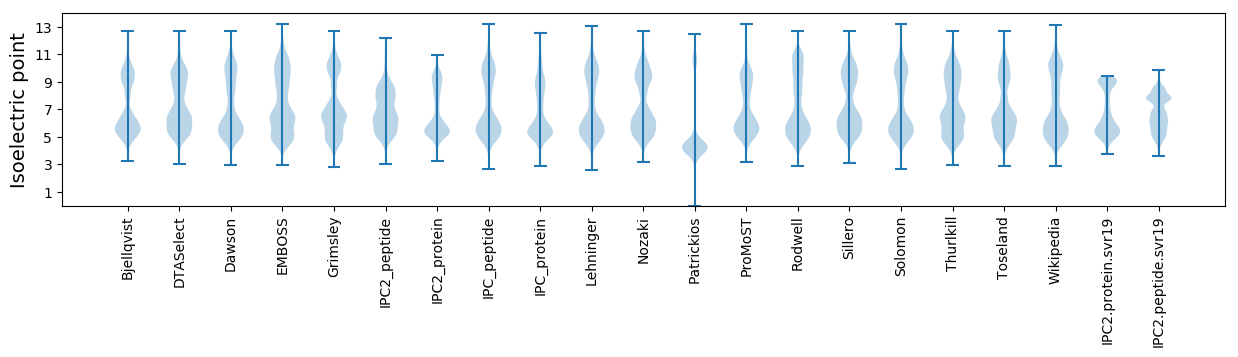
* You can choose from 21 different methods for calculating isoelectric point
Summary statistics related to proteome-wise predictions
Protein with the lowest isoelectric point:
>tr|D6TY45|D6TY45_9CHLR Uncharacterized protein OS=Ktedonobacter racemifer DSM 44963 OX=485913 GN=Krac_6180 PE=4 SV=1
MM1 pKa = 7.27QIAALQEE8 pKa = 4.29GSASDD13 pKa = 3.56EE14 pKa = 3.94FAIYY18 pKa = 9.91SWPEE22 pKa = 3.39RR23 pKa = 11.84QLLQRR28 pKa = 11.84YY29 pKa = 7.96PVMPALDD36 pKa = 4.11GWPVDD41 pKa = 4.06MVLSPQDD48 pKa = 3.65NLALCMFANEE58 pKa = 4.79DD59 pKa = 3.65DD60 pKa = 4.12VSFEE64 pKa = 4.62FIDD67 pKa = 3.41ITSQGVSQDD76 pKa = 2.85LHH78 pKa = 7.67LYY80 pKa = 9.97KK81 pKa = 10.82GAII84 pKa = 3.65
MM1 pKa = 7.27QIAALQEE8 pKa = 4.29GSASDD13 pKa = 3.56EE14 pKa = 3.94FAIYY18 pKa = 9.91SWPEE22 pKa = 3.39RR23 pKa = 11.84QLLQRR28 pKa = 11.84YY29 pKa = 7.96PVMPALDD36 pKa = 4.11GWPVDD41 pKa = 4.06MVLSPQDD48 pKa = 3.65NLALCMFANEE58 pKa = 4.79DD59 pKa = 3.65DD60 pKa = 4.12VSFEE64 pKa = 4.62FIDD67 pKa = 3.41ITSQGVSQDD76 pKa = 2.85LHH78 pKa = 7.67LYY80 pKa = 9.97KK81 pKa = 10.82GAII84 pKa = 3.65
Molecular weight: 9.44 kDa
Isoelectric point according different methods:
Protein with the highest isoelectric point:
>tr|D6TXN5|D6TXN5_9CHLR Uncharacterized protein OS=Ktedonobacter racemifer DSM 44963 OX=485913 GN=Krac_3999 PE=4 SV=1
MM1 pKa = 7.15FVLSRR6 pKa = 11.84RR7 pKa = 11.84QRR9 pKa = 11.84RR10 pKa = 11.84VMMRR14 pKa = 11.84FLQALAVQGVVLVVRR29 pKa = 11.84HH30 pKa = 5.02WLHH33 pKa = 5.28WW34 pKa = 3.94
MM1 pKa = 7.15FVLSRR6 pKa = 11.84RR7 pKa = 11.84QRR9 pKa = 11.84RR10 pKa = 11.84VMMRR14 pKa = 11.84FLQALAVQGVVLVVRR29 pKa = 11.84HH30 pKa = 5.02WLHH33 pKa = 5.28WW34 pKa = 3.94
Molecular weight: 4.22 kDa
Isoelectric point according different methods:
Peptides (in silico digests for buttom-up proteomics)
Below you can find in silico digests of the whole proteome with Trypsin, Chymotrypsin, Trypsin+LysC, LysN, ArgC proteases suitable for different mass spec machines.| Try ESI |
 |
|---|
| ChTry ESI |
|
|---|
| ArgC ESI |
|
|---|
| LysN ESI |
|
|---|
| TryLysC ESI |
|
|---|
| Try MALDI |
|
|---|
| ChTry MALDI |
|
|---|
| ArgC MALDI |
|
|---|
| LysN MALDI |
|
|---|
| TryLysC MALDI |
|
|---|
| Try LTQ |
|
|---|
| ChTry LTQ |
|
|---|
| ArgC LTQ |
|
|---|
| LysN LTQ |
|
|---|
| TryLysC LTQ |
|
|---|
| Try MSlow |
|
|---|
| ChTry MSlow |
|
|---|
| ArgC MSlow |
|
|---|
| LysN MSlow |
|
|---|
| TryLysC MSlow |
|
|---|
| Try MShigh |
|
|---|
| ChTry MShigh |
|
|---|
| ArgC MShigh |
|
|---|
| LysN MShigh |
|
|---|
| TryLysC MShigh |
|
|---|
General Statistics
Number of major isoforms |
Number of additional isoforms |
Number of all proteins |
Number of amino acids |
Min. Seq. Length |
Max. Seq. Length |
Avg. Seq. Length |
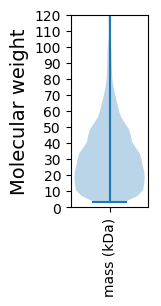
Avg. Mol. Weight |
|---|---|---|---|---|---|---|---|
0 |
3395074 |
30 |
3346 |
302.8 |
33.72 |
Amino acid frequency
Ala |
Cys |
Asp |
Glu |
Phe |
Gly |
His |
Ile |
Lys |
Leu |
|---|---|---|---|---|---|---|---|---|---|
9.38 ± 0.025 | 1.117 ± 0.008 |
4.511 ± 0.016 | 6.099 ± 0.029 |
3.604 ± 0.015 | 7.039 ± 0.02 |
2.743 ± 0.011 | 5.322 ± 0.019 |
3.569 ± 0.023 | 11.154 ± 0.034 |
Met |
Asn |
Gln |
Pro |
Arg |
Ser |
Thr |
Val |
Trp |
Tyr |
|---|---|---|---|---|---|---|---|---|---|
2.209 ± 0.009 | 3.032 ± 0.016 |
5.102 ± 0.019 | 5.205 ± 0.02 |
6.618 ± 0.023 | 6.126 ± 0.021 |
5.889 ± 0.019 | 6.668 ± 0.019 |
1.594 ± 0.011 | 3.019 ± 0.013 |
Most of the basic statistics you can see at this page can be downloaded from this CSV file
See this proteome in:

Proteome-pI is available under Creative Commons Attribution-NoDerivs license, for more details see here
| Reference: Kozlowski LP. Proteome-pI 2.0: Proteome Isoelectric Point Database Update. Nucleic Acids Res. 2021, doi: 10.1093/nar/gkab944 | Contact: Lukasz P. Kozlowski |