Synechococcus phage S-RSM4
Taxonomy: Viruses; Duplodnaviria; Heunggongvirae; Uroviricota; Caudoviricetes; Caudovirales; Myoviridae; Cymopoleiavirus; unclassified Cymopoleiavirus
Average proteome isoelectric point is 5.66
Get precalculated fractions of proteins
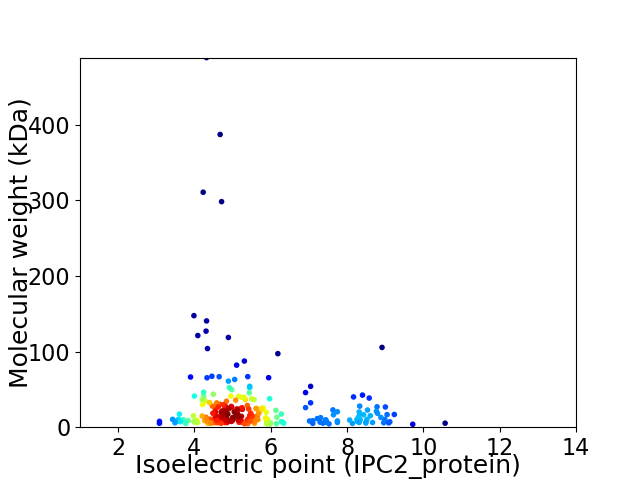
Virtual 2D-PAGE plot for 237 proteins (isoelectric point calculated using IPC2_protein)
Get csv file with sequences according to given criteria:
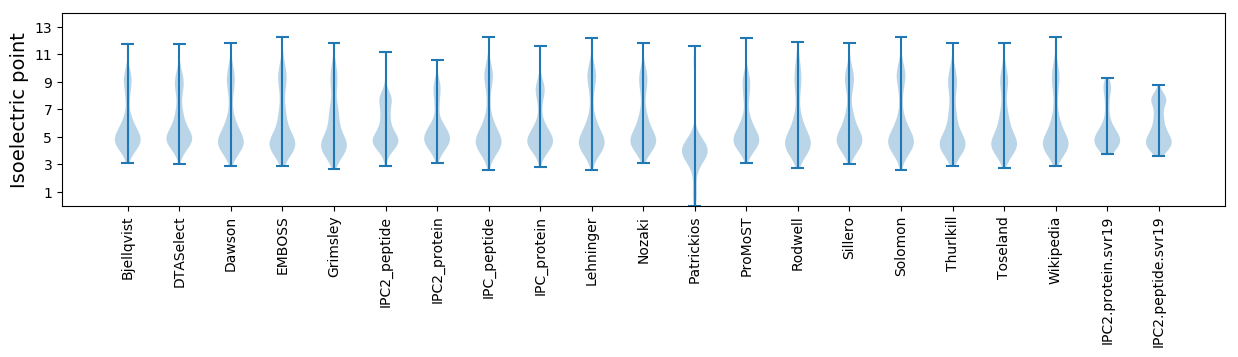
* You can choose from 21 different methods for calculating isoelectric point
Summary statistics related to proteome-wise predictions
Protein with the lowest isoelectric point:
>tr|C7BUY8|C7BUY8_9CAUD Photosystem II OS=Synechococcus phage S-RSM4 OX=555387 GN=psbD PE=3 SV=1
MM1 pKa = 7.2AQATVLYY8 pKa = 9.56FSATVSFIFLCVGVIAGWTANEE30 pKa = 4.01KK31 pKa = 10.33LHH33 pKa = 6.08EE34 pKa = 4.23FMYY37 pKa = 10.76GKK39 pKa = 10.1AQEE42 pKa = 4.4EE43 pKa = 4.51NIHH46 pKa = 6.71PEE48 pKa = 3.91MLDD51 pKa = 5.51GEE53 pKa = 4.67GQWINEE59 pKa = 4.03EE60 pKa = 4.08LLSVRR65 pKa = 11.84FVDD68 pKa = 5.73EE69 pKa = 6.2DD70 pKa = 4.53DD71 pKa = 5.82DD72 pKa = 7.0DD73 pKa = 6.54YY74 pKa = 12.18DD75 pKa = 4.35DD76 pKa = 4.26
MM1 pKa = 7.2AQATVLYY8 pKa = 9.56FSATVSFIFLCVGVIAGWTANEE30 pKa = 4.01KK31 pKa = 10.33LHH33 pKa = 6.08EE34 pKa = 4.23FMYY37 pKa = 10.76GKK39 pKa = 10.1AQEE42 pKa = 4.4EE43 pKa = 4.51NIHH46 pKa = 6.71PEE48 pKa = 3.91MLDD51 pKa = 5.51GEE53 pKa = 4.67GQWINEE59 pKa = 4.03EE60 pKa = 4.08LLSVRR65 pKa = 11.84FVDD68 pKa = 5.73EE69 pKa = 6.2DD70 pKa = 4.53DD71 pKa = 5.82DD72 pKa = 7.0DD73 pKa = 6.54YY74 pKa = 12.18DD75 pKa = 4.35DD76 pKa = 4.26
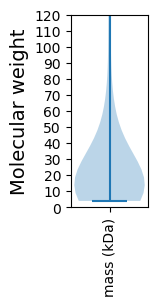
Molecular weight: 8.71 kDa
Isoelectric point according different methods:
Protein with the highest isoelectric point:
>tr|C7BV11|C7BV11_9CAUD Hypothetical cyanophage protein OS=Synechococcus phage S-RSM4 OX=555387 GN=SRSM4_043 PE=4 SV=1
MM1 pKa = 7.62GFTTPRR7 pKa = 11.84VSYY10 pKa = 9.43FLKK13 pKa = 10.94VSGADD18 pKa = 3.27GNTPAWFLASSQRR31 pKa = 11.84ASGGSKK37 pKa = 10.27
MM1 pKa = 7.62GFTTPRR7 pKa = 11.84VSYY10 pKa = 9.43FLKK13 pKa = 10.94VSGADD18 pKa = 3.27GNTPAWFLASSQRR31 pKa = 11.84ASGGSKK37 pKa = 10.27
Molecular weight: 3.88 kDa
Isoelectric point according different methods:
Peptides (in silico digests for buttom-up proteomics)
Below you can find in silico digests of the whole proteome with Trypsin, Chymotrypsin, Trypsin+LysC, LysN, ArgC proteases suitable for different mass spec machines.| Try ESI |
 |
|---|
| ChTry ESI |
|
|---|
| ArgC ESI |
|
|---|
| LysN ESI |
|
|---|
| TryLysC ESI |
|
|---|
| Try MALDI |
|
|---|
| ChTry MALDI |
|
|---|
| ArgC MALDI |
|
|---|
| LysN MALDI |
|
|---|
| TryLysC MALDI |
|
|---|
| Try LTQ |
|
|---|
| ChTry LTQ |
|
|---|
| ArgC LTQ |
|
|---|
| LysN LTQ |
|
|---|
| TryLysC LTQ |
|
|---|
| Try MSlow |
|
|---|
| ChTry MSlow |
|
|---|
| ArgC MSlow |
|
|---|
| LysN MSlow |
|
|---|
| TryLysC MSlow |
|
|---|
| Try MShigh |
|
|---|
| ChTry MShigh |
|
|---|
| ArgC MShigh |
|
|---|
| LysN MShigh |
|
|---|
| TryLysC MShigh |
|
|---|
General Statistics
Number of major isoforms |
Number of additional isoforms |
Number of all proteins |
Number of amino acids |
Min. Seq. Length |
Max. Seq. Length |
Avg. Seq. Length |
Avg. Mol. Weight |
|---|---|---|---|---|---|---|---|
0 |
60981 |
37 |
4482 |
257.3 |
28.56 |
Amino acid frequency
Ala |
Cys |
Asp |
Glu |
Phe |
Gly |
His |
Ile |
Lys |
Leu |
|---|---|---|---|---|---|---|---|---|---|
6.884 ± 0.22 | 0.841 ± 0.074 |
6.878 ± 0.137 | 6.248 ± 0.231 |
4.408 ± 0.104 | 8.142 ± 0.405 |
1.469 ± 0.112 | 6.235 ± 0.15 |
5.426 ± 0.297 | 7.071 ± 0.145 |
Met |
Asn |
Gln |
Pro |
Arg |
Ser |
Thr |
Val |
Trp |
Tyr |
|---|---|---|---|---|---|---|---|---|---|
1.871 ± 0.174 | 5.912 ± 0.151 |
4.023 ± 0.097 | 3.68 ± 0.111 |
4.101 ± 0.132 | 6.956 ± 0.238 |
7.422 ± 0.316 | 6.753 ± 0.178 |
1.194 ± 0.084 | 4.487 ± 0.149 |
Most of the basic statistics you can see at this page can be downloaded from this CSV file
See this proteome in:

Proteome-pI is available under Creative Commons Attribution-NoDerivs license, for more details see here
| Reference: Kozlowski LP. Proteome-pI 2.0: Proteome Isoelectric Point Database Update. Nucleic Acids Res. 2021, doi: 10.1093/nar/gkab944 | Contact: Lukasz P. Kozlowski |