Pyrinomonas methylaliphatogenes
Taxonomy: cellular organisms; Bacteria; Acidobacteria; Blastocatellia; Blastocatellales; Pyrinomonadaceae; Pyrinomonas
Average proteome isoelectric point is 6.99
Get precalculated fractions of proteins
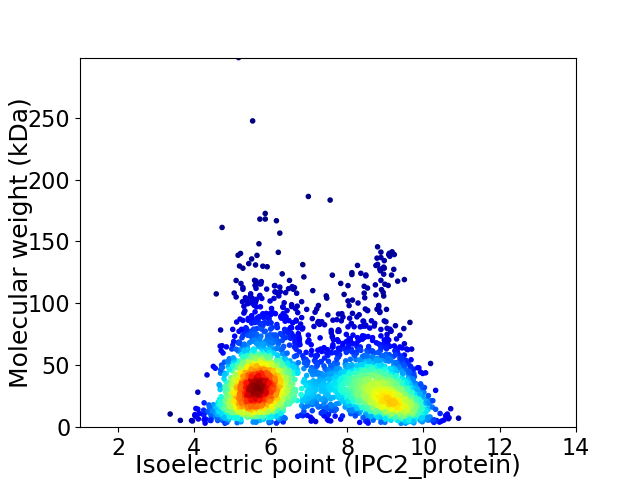
Virtual 2D-PAGE plot for 3179 proteins (isoelectric point calculated using IPC2_protein)
Get csv file with sequences according to given criteria:
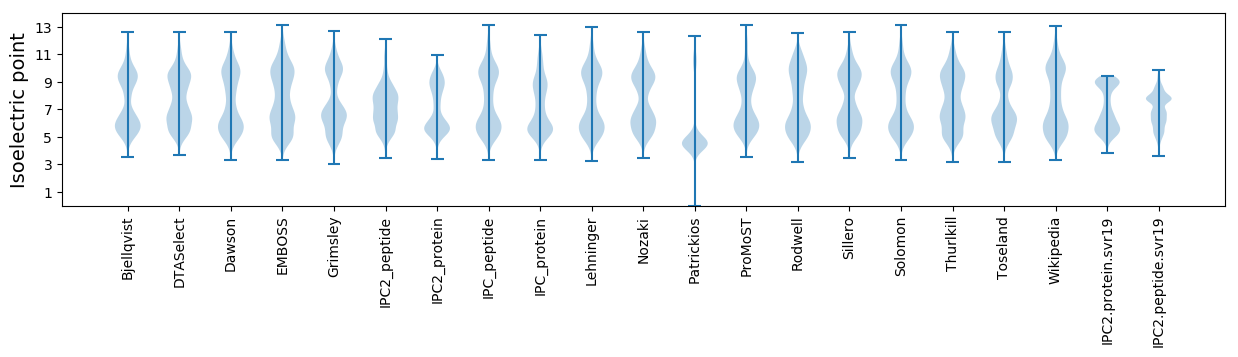
* You can choose from 21 different methods for calculating isoelectric point
Summary statistics related to proteome-wise predictions
Protein with the lowest isoelectric point:
>tr|A0A0B6X3J1|A0A0B6X3J1_9BACT Predicted hydrolase of the alpha/beta superfamily OS=Pyrinomonas methylaliphatogenes OX=454194 GN=PYK22_02909 PE=4 SV=1
MM1 pKa = 7.37CTPTPYY7 pKa = 10.41NGVPAAVPGKK17 pKa = 10.46VEE19 pKa = 3.9AEE21 pKa = 4.28EE22 pKa = 4.37YY23 pKa = 10.98DD24 pKa = 4.85DD25 pKa = 6.73DD26 pKa = 5.1GDD28 pKa = 4.17CDD30 pKa = 3.78GFYY33 pKa = 10.87VPPYY37 pKa = 10.01YY38 pKa = 10.08EE39 pKa = 5.2PKK41 pKa = 10.12PDD43 pKa = 5.14DD44 pKa = 3.98PDD46 pKa = 3.14IVYY49 pKa = 10.26NYY51 pKa = 10.29PEE53 pKa = 4.43VLPVDD58 pKa = 4.86LNAPDD63 pKa = 4.42KK64 pKa = 9.82EE65 pKa = 4.41EE66 pKa = 3.93KK67 pKa = 10.09VAMVGGEE74 pKa = 4.2WINYY78 pKa = 6.17TISVTVAGEE87 pKa = 3.68YY88 pKa = 10.39RR89 pKa = 11.84FAARR93 pKa = 11.84VASAVDD99 pKa = 3.67GEE101 pKa = 4.57SFHH104 pKa = 8.25VKK106 pKa = 9.31IDD108 pKa = 3.55GVNRR112 pKa = 11.84TGSVIIPNTGSWDD125 pKa = 3.56SYY127 pKa = 11.14QMVEE131 pKa = 3.97ADD133 pKa = 4.41LGYY136 pKa = 10.74LEE138 pKa = 5.21AGRR141 pKa = 11.84HH142 pKa = 4.19VMRR145 pKa = 11.84LAIEE149 pKa = 4.47GNSEE153 pKa = 3.85KK154 pKa = 10.62SGHH157 pKa = 5.96FDD159 pKa = 3.42YY160 pKa = 11.44YY161 pKa = 11.34LLTLPPPCTDD171 pKa = 3.28NDD173 pKa = 3.87GDD175 pKa = 4.84GYY177 pKa = 11.18CSDD180 pKa = 4.49VDD182 pKa = 4.27CDD184 pKa = 4.74DD185 pKa = 4.52WDD187 pKa = 4.0PLNYY191 pKa = 9.87PGAPRR196 pKa = 11.84DD197 pKa = 3.58CSSWVDD203 pKa = 3.63RR204 pKa = 11.84DD205 pKa = 3.52CDD207 pKa = 4.29GIPNRR212 pKa = 11.84EE213 pKa = 3.95EE214 pKa = 4.2CSFGGPGPILSLLDD228 pKa = 3.77SFDD231 pKa = 2.9RR232 pKa = 11.84WFAFNSRR239 pKa = 11.84LGADD243 pKa = 4.7LIRR246 pKa = 11.84PVSMRR251 pKa = 11.84RR252 pKa = 11.84RR253 pKa = 11.84CRR255 pKa = 3.26
MM1 pKa = 7.37CTPTPYY7 pKa = 10.41NGVPAAVPGKK17 pKa = 10.46VEE19 pKa = 3.9AEE21 pKa = 4.28EE22 pKa = 4.37YY23 pKa = 10.98DD24 pKa = 4.85DD25 pKa = 6.73DD26 pKa = 5.1GDD28 pKa = 4.17CDD30 pKa = 3.78GFYY33 pKa = 10.87VPPYY37 pKa = 10.01YY38 pKa = 10.08EE39 pKa = 5.2PKK41 pKa = 10.12PDD43 pKa = 5.14DD44 pKa = 3.98PDD46 pKa = 3.14IVYY49 pKa = 10.26NYY51 pKa = 10.29PEE53 pKa = 4.43VLPVDD58 pKa = 4.86LNAPDD63 pKa = 4.42KK64 pKa = 9.82EE65 pKa = 4.41EE66 pKa = 3.93KK67 pKa = 10.09VAMVGGEE74 pKa = 4.2WINYY78 pKa = 6.17TISVTVAGEE87 pKa = 3.68YY88 pKa = 10.39RR89 pKa = 11.84FAARR93 pKa = 11.84VASAVDD99 pKa = 3.67GEE101 pKa = 4.57SFHH104 pKa = 8.25VKK106 pKa = 9.31IDD108 pKa = 3.55GVNRR112 pKa = 11.84TGSVIIPNTGSWDD125 pKa = 3.56SYY127 pKa = 11.14QMVEE131 pKa = 3.97ADD133 pKa = 4.41LGYY136 pKa = 10.74LEE138 pKa = 5.21AGRR141 pKa = 11.84HH142 pKa = 4.19VMRR145 pKa = 11.84LAIEE149 pKa = 4.47GNSEE153 pKa = 3.85KK154 pKa = 10.62SGHH157 pKa = 5.96FDD159 pKa = 3.42YY160 pKa = 11.44YY161 pKa = 11.34LLTLPPPCTDD171 pKa = 3.28NDD173 pKa = 3.87GDD175 pKa = 4.84GYY177 pKa = 11.18CSDD180 pKa = 4.49VDD182 pKa = 4.27CDD184 pKa = 4.74DD185 pKa = 4.52WDD187 pKa = 4.0PLNYY191 pKa = 9.87PGAPRR196 pKa = 11.84DD197 pKa = 3.58CSSWVDD203 pKa = 3.63RR204 pKa = 11.84DD205 pKa = 3.52CDD207 pKa = 4.29GIPNRR212 pKa = 11.84EE213 pKa = 3.95EE214 pKa = 4.2CSFGGPGPILSLLDD228 pKa = 3.77SFDD231 pKa = 2.9RR232 pKa = 11.84WFAFNSRR239 pKa = 11.84LGADD243 pKa = 4.7LIRR246 pKa = 11.84PVSMRR251 pKa = 11.84RR252 pKa = 11.84RR253 pKa = 11.84CRR255 pKa = 3.26
Molecular weight: 28.27 kDa
Isoelectric point according different methods:
Protein with the highest isoelectric point:
>tr|A0A0B6X150|A0A0B6X150_9BACT Predicted nucleotidyltransferase OS=Pyrinomonas methylaliphatogenes OX=454194 GN=PYK22_02750 PE=4 SV=1
MM1 pKa = 7.33KK2 pKa = 10.44RR3 pKa = 11.84IALVLAFVLTLGLGSFAAAQTTSGQNTNTSASSSASTAKK42 pKa = 9.65TKK44 pKa = 9.15RR45 pKa = 11.84HH46 pKa = 4.83KK47 pKa = 10.06RR48 pKa = 11.84AHH50 pKa = 5.62KK51 pKa = 9.74RR52 pKa = 11.84AKK54 pKa = 9.88KK55 pKa = 10.45SKK57 pKa = 9.21ATNTNANTNTSRR69 pKa = 3.76
MM1 pKa = 7.33KK2 pKa = 10.44RR3 pKa = 11.84IALVLAFVLTLGLGSFAAAQTTSGQNTNTSASSSASTAKK42 pKa = 9.65TKK44 pKa = 9.15RR45 pKa = 11.84HH46 pKa = 4.83KK47 pKa = 10.06RR48 pKa = 11.84AHH50 pKa = 5.62KK51 pKa = 9.74RR52 pKa = 11.84AKK54 pKa = 9.88KK55 pKa = 10.45SKK57 pKa = 9.21ATNTNANTNTSRR69 pKa = 3.76
Molecular weight: 7.26 kDa
Isoelectric point according different methods:
Peptides (in silico digests for buttom-up proteomics)
Below you can find in silico digests of the whole proteome with Trypsin, Chymotrypsin, Trypsin+LysC, LysN, ArgC proteases suitable for different mass spec machines.| Try ESI |
 |
|---|
| ChTry ESI |
|
|---|
| ArgC ESI |
|
|---|
| LysN ESI |
|
|---|
| TryLysC ESI |
|
|---|
| Try MALDI |
|
|---|
| ChTry MALDI |
|
|---|
| ArgC MALDI |
|
|---|
| LysN MALDI |
|
|---|
| TryLysC MALDI |
|
|---|
| Try LTQ |
|
|---|
| ChTry LTQ |
|
|---|
| ArgC LTQ |
|
|---|
| LysN LTQ |
|
|---|
| TryLysC LTQ |
|
|---|
| Try MSlow |
|
|---|
| ChTry MSlow |
|
|---|
| ArgC MSlow |
|
|---|
| LysN MSlow |
|
|---|
| TryLysC MSlow |
|
|---|
| Try MShigh |
|
|---|
| ChTry MShigh |
|
|---|
| ArgC MShigh |
|
|---|
| LysN MShigh |
|
|---|
| TryLysC MShigh |
|
|---|
General Statistics
Number of major isoforms |
Number of additional isoforms |
Number of all proteins |
Number of amino acids |
Min. Seq. Length |
Max. Seq. Length |
Avg. Seq. Length |
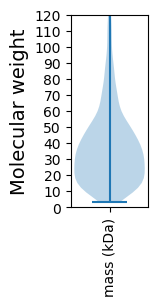
Avg. Mol. Weight |
|---|---|---|---|---|---|---|---|
0 |
1112582 |
29 |
2744 |
350.0 |
38.87 |
Amino acid frequency
Ala |
Cys |
Asp |
Glu |
Phe |
Gly |
His |
Ile |
Lys |
Leu |
|---|---|---|---|---|---|---|---|---|---|
11.027 ± 0.064 | 0.884 ± 0.016 |
5.055 ± 0.028 | 7.183 ± 0.058 |
3.94 ± 0.035 | 7.581 ± 0.042 |
1.879 ± 0.018 | 5.871 ± 0.031 |
3.132 ± 0.033 | 10.258 ± 0.044 |
Met |
Asn |
Gln |
Pro |
Arg |
Ser |
Thr |
Val |
Trp |
Tyr |
|---|---|---|---|---|---|---|---|---|---|
1.915 ± 0.017 | 2.846 ± 0.039 |
4.827 ± 0.034 | 3.247 ± 0.028 |
9.118 ± 0.043 | 5.261 ± 0.028 |
4.99 ± 0.03 | 7.0 ± 0.031 |
1.246 ± 0.019 | 2.739 ± 0.025 |
Most of the basic statistics you can see at this page can be downloaded from this CSV file
See this proteome in:

Proteome-pI is available under Creative Commons Attribution-NoDerivs license, for more details see here
| Reference: Kozlowski LP. Proteome-pI 2.0: Proteome Isoelectric Point Database Update. Nucleic Acids Res. 2021, doi: 10.1093/nar/gkab944 | Contact: Lukasz P. Kozlowski |