Salmonella phage SE1 (in:P22virus)
Taxonomy: Viruses; Duplodnaviria; Heunggongvirae; Uroviricota; Caudoviricetes; Caudovirales; Podoviridae; Lederbergvirus; Salmonella virus SE1Spa
Average proteome isoelectric point is 6.91
Get precalculated fractions of proteins
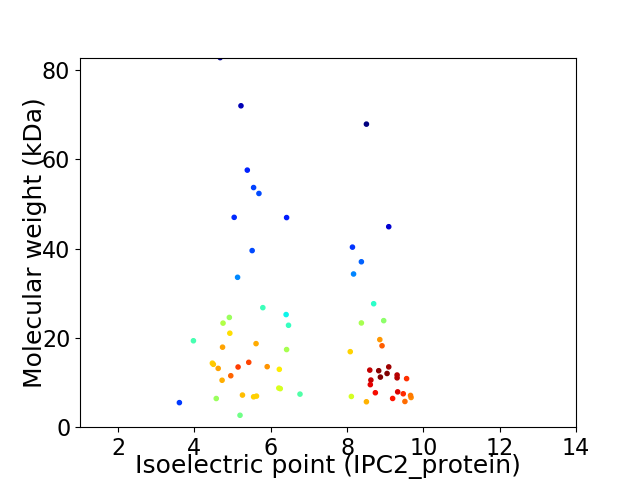
Virtual 2D-PAGE plot for 67 proteins (isoelectric point calculated using IPC2_protein)
Get csv file with sequences according to given criteria:
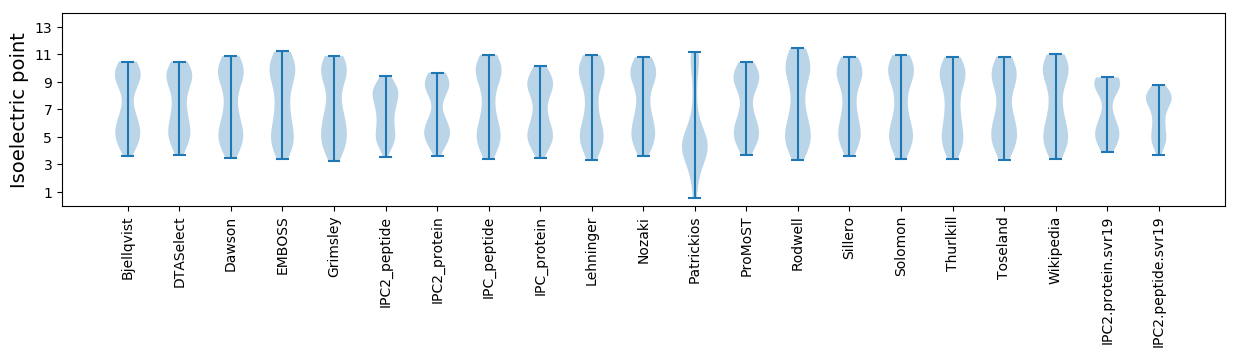
* You can choose from 21 different methods for calculating isoelectric point
Summary statistics related to proteome-wise predictions
Protein with the lowest isoelectric point:
>tr|B8K1E1|B8K1E1_9CAUD Kil OS=Salmonella phage SE1 (in:P22virus) OX=329864 GN=orf17 PE=4 SV=1
MM1 pKa = 7.29LHH3 pKa = 7.3DD4 pKa = 4.58FDD6 pKa = 7.13DD7 pKa = 5.13DD8 pKa = 3.82EE9 pKa = 5.6FIALISPEE17 pKa = 3.74IEE19 pKa = 3.94EE20 pKa = 4.61EE21 pKa = 4.24VEE23 pKa = 4.03QQINLAAEE31 pKa = 4.08RR32 pKa = 11.84QNPIIGWDD40 pKa = 3.51EE41 pKa = 3.66FAGYY45 pKa = 10.64YY46 pKa = 9.62SS47 pKa = 3.45
MM1 pKa = 7.29LHH3 pKa = 7.3DD4 pKa = 4.58FDD6 pKa = 7.13DD7 pKa = 5.13DD8 pKa = 3.82EE9 pKa = 5.6FIALISPEE17 pKa = 3.74IEE19 pKa = 3.94EE20 pKa = 4.61EE21 pKa = 4.24VEE23 pKa = 4.03QQINLAAEE31 pKa = 4.08RR32 pKa = 11.84QNPIIGWDD40 pKa = 3.51EE41 pKa = 3.66FAGYY45 pKa = 10.64YY46 pKa = 9.62SS47 pKa = 3.45
Molecular weight: 5.5 kDa
Isoelectric point according different methods:
Protein with the highest isoelectric point:
>tr|B8K1G1|B8K1G1_9CAUD NinX OS=Salmonella phage SE1 (in:P22virus) OX=329864 GN=orf37 PE=4 SV=1
MM1 pKa = 7.39ARR3 pKa = 11.84QRR5 pKa = 11.84RR6 pKa = 11.84SITDD10 pKa = 4.1IICEE14 pKa = 3.96NCKK17 pKa = 10.21YY18 pKa = 10.77LPTKK22 pKa = 10.48RR23 pKa = 11.84SRR25 pKa = 11.84NKK27 pKa = 9.55PKK29 pKa = 10.29PIPKK33 pKa = 9.96EE34 pKa = 3.93SDD36 pKa = 3.19VKK38 pKa = 9.6TFNYY42 pKa = 7.51TAHH45 pKa = 6.73LWDD48 pKa = 3.61IRR50 pKa = 11.84WLRR53 pKa = 11.84EE54 pKa = 3.64RR55 pKa = 11.84ARR57 pKa = 11.84KK58 pKa = 8.87
MM1 pKa = 7.39ARR3 pKa = 11.84QRR5 pKa = 11.84RR6 pKa = 11.84SITDD10 pKa = 4.1IICEE14 pKa = 3.96NCKK17 pKa = 10.21YY18 pKa = 10.77LPTKK22 pKa = 10.48RR23 pKa = 11.84SRR25 pKa = 11.84NKK27 pKa = 9.55PKK29 pKa = 10.29PIPKK33 pKa = 9.96EE34 pKa = 3.93SDD36 pKa = 3.19VKK38 pKa = 9.6TFNYY42 pKa = 7.51TAHH45 pKa = 6.73LWDD48 pKa = 3.61IRR50 pKa = 11.84WLRR53 pKa = 11.84EE54 pKa = 3.64RR55 pKa = 11.84ARR57 pKa = 11.84KK58 pKa = 8.87
Molecular weight: 7.12 kDa
Isoelectric point according different methods:
Peptides (in silico digests for buttom-up proteomics)
Below you can find in silico digests of the whole proteome with Trypsin, Chymotrypsin, Trypsin+LysC, LysN, ArgC proteases suitable for different mass spec machines.| Try ESI |
 |
|---|
| ChTry ESI |
|
|---|
| ArgC ESI |
|
|---|
| LysN ESI |
|
|---|
| TryLysC ESI |
|
|---|
| Try MALDI |
|
|---|
| ChTry MALDI |
|
|---|
| ArgC MALDI |
|
|---|
| LysN MALDI |
|
|---|
| TryLysC MALDI |
|
|---|
| Try LTQ |
|
|---|
| ChTry LTQ |
|
|---|
| ArgC LTQ |
|
|---|
| LysN LTQ |
|
|---|
| TryLysC LTQ |
|
|---|
| Try MSlow |
|
|---|
| ChTry MSlow |
|
|---|
| ArgC MSlow |
|
|---|
| LysN MSlow |
|
|---|
| TryLysC MSlow |
|
|---|
| Try MShigh |
|
|---|
| ChTry MShigh |
|
|---|
| ArgC MShigh |
|
|---|
| LysN MShigh |
|
|---|
| TryLysC MShigh |
|
|---|
General Statistics
Number of major isoforms |
Number of additional isoforms |
Number of all proteins |
Number of amino acids |
Min. Seq. Length |
Max. Seq. Length |
Avg. Seq. Length |
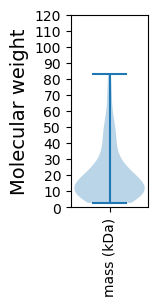
Avg. Mol. Weight |
|---|---|---|---|---|---|---|---|
0 |
12626 |
25 |
725 |
188.4 |
21.08 |
Amino acid frequency
Ala |
Cys |
Asp |
Glu |
Phe |
Gly |
His |
Ile |
Lys |
Leu |
|---|---|---|---|---|---|---|---|---|---|
9.203 ± 0.522 | 1.339 ± 0.165 |
5.948 ± 0.273 | 6.336 ± 0.359 |
3.667 ± 0.289 | 6.906 ± 0.39 |
1.766 ± 0.178 | 6.178 ± 0.369 |
6.17 ± 0.304 | 7.896 ± 0.28 |
Met |
Asn |
Gln |
Pro |
Arg |
Ser |
Thr |
Val |
Trp |
Tyr |
|---|---|---|---|---|---|---|---|---|---|
2.867 ± 0.167 | 4.808 ± 0.237 |
3.96 ± 0.175 | 4.507 ± 0.354 |
5.901 ± 0.264 | 6.423 ± 0.309 |
5.402 ± 0.234 | 5.893 ± 0.252 |
1.6 ± 0.162 | 3.231 ± 0.209 |
Most of the basic statistics you can see at this page can be downloaded from this CSV file
See this proteome in:

Proteome-pI is available under Creative Commons Attribution-NoDerivs license, for more details see here
| Reference: Kozlowski LP. Proteome-pI 2.0: Proteome Isoelectric Point Database Update. Nucleic Acids Res. 2021, doi: 10.1093/nar/gkab944 | Contact: Lukasz P. Kozlowski |