Pseudomonas asplenii
Taxonomy: cellular organisms; Bacteria; Proteobacteria; Gammaproteobacteria; Pseudomonadales; Pseudomonadaceae; Pseudomonas
Average proteome isoelectric point is 6.45
Get precalculated fractions of proteins
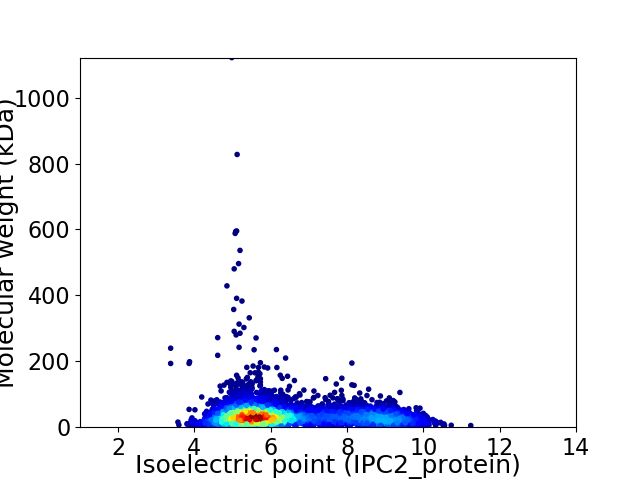
Virtual 2D-PAGE plot for 5596 proteins (isoelectric point calculated using IPC2_protein)
Get csv file with sequences according to given criteria:
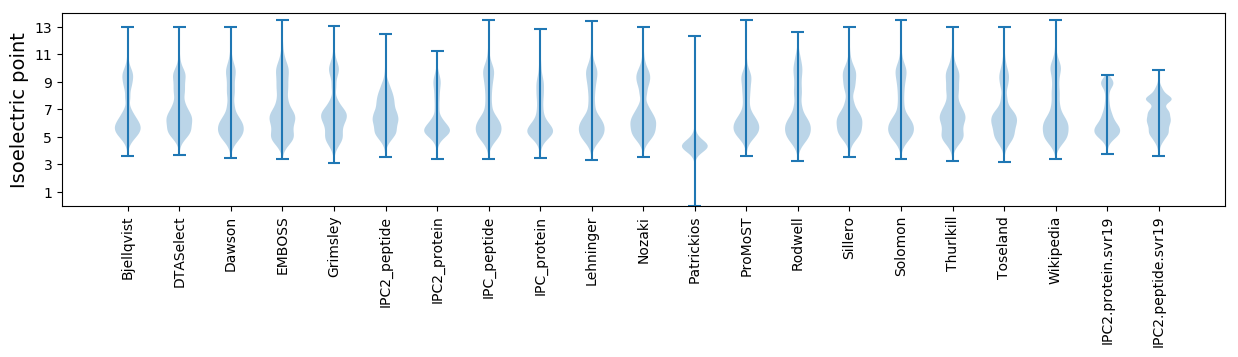
* You can choose from 21 different methods for calculating isoelectric point
Summary statistics related to proteome-wise predictions
Protein with the lowest isoelectric point:
>tr|A0A1H1S9F7|A0A1H1S9F7_9PSED Putative ABC transport system ATP-binding protein OS=Pseudomonas asplenii OX=53407 GN=SAMN05216598_1621 PE=4 SV=1
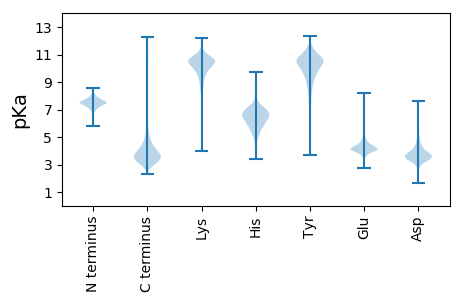
MM1 pKa = 7.56KK2 pKa = 10.16KK3 pKa = 8.28WQCVVCGLIYY13 pKa = 10.91NEE15 pKa = 3.94ADD17 pKa = 2.82GWPDD21 pKa = 3.42DD22 pKa = 4.75GIVAGTRR29 pKa = 11.84WEE31 pKa = 4.36DD32 pKa = 3.55VPEE35 pKa = 4.63DD36 pKa = 4.22WLCPDD41 pKa = 4.47CGVGKK46 pKa = 10.5ADD48 pKa = 4.11FEE50 pKa = 4.64MIEE53 pKa = 4.1IAA55 pKa = 5.16
MM1 pKa = 7.56KK2 pKa = 10.16KK3 pKa = 8.28WQCVVCGLIYY13 pKa = 10.91NEE15 pKa = 3.94ADD17 pKa = 2.82GWPDD21 pKa = 3.42DD22 pKa = 4.75GIVAGTRR29 pKa = 11.84WEE31 pKa = 4.36DD32 pKa = 3.55VPEE35 pKa = 4.63DD36 pKa = 4.22WLCPDD41 pKa = 4.47CGVGKK46 pKa = 10.5ADD48 pKa = 4.11FEE50 pKa = 4.64MIEE53 pKa = 4.1IAA55 pKa = 5.16
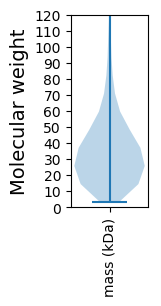
Molecular weight: 6.18 kDa
Isoelectric point according different methods:
Protein with the highest isoelectric point:
>tr|A0A1H1S0H6|A0A1H1S0H6_9PSED Uncharacterized protein OS=Pseudomonas asplenii OX=53407 GN=SAMN05216598_1495 PE=4 SV=1
MM1 pKa = 7.45KK2 pKa = 9.56RR3 pKa = 11.84TFQPSTIKK11 pKa = 10.52RR12 pKa = 11.84ARR14 pKa = 11.84THH16 pKa = 5.94GFRR19 pKa = 11.84ARR21 pKa = 11.84MATKK25 pKa = 10.16NGRR28 pKa = 11.84AVLSRR33 pKa = 11.84RR34 pKa = 11.84RR35 pKa = 11.84AKK37 pKa = 10.38GRR39 pKa = 11.84ARR41 pKa = 11.84LAVV44 pKa = 3.42
MM1 pKa = 7.45KK2 pKa = 9.56RR3 pKa = 11.84TFQPSTIKK11 pKa = 10.52RR12 pKa = 11.84ARR14 pKa = 11.84THH16 pKa = 5.94GFRR19 pKa = 11.84ARR21 pKa = 11.84MATKK25 pKa = 10.16NGRR28 pKa = 11.84AVLSRR33 pKa = 11.84RR34 pKa = 11.84RR35 pKa = 11.84AKK37 pKa = 10.38GRR39 pKa = 11.84ARR41 pKa = 11.84LAVV44 pKa = 3.42
Molecular weight: 5.07 kDa
Isoelectric point according different methods:
Peptides (in silico digests for buttom-up proteomics)
Below you can find in silico digests of the whole proteome with Trypsin, Chymotrypsin, Trypsin+LysC, LysN, ArgC proteases suitable for different mass spec machines.| Try ESI |
 |
|---|
| ChTry ESI |
|
|---|
| ArgC ESI |
|
|---|
| LysN ESI |
|
|---|
| TryLysC ESI |
|
|---|
| Try MALDI |
|
|---|
| ChTry MALDI |
|
|---|
| ArgC MALDI |
|
|---|
| LysN MALDI |
|
|---|
| TryLysC MALDI |
|
|---|
| Try LTQ |
|
|---|
| ChTry LTQ |
|
|---|
| ArgC LTQ |
|
|---|
| LysN LTQ |
|
|---|
| TryLysC LTQ |
|
|---|
| Try MSlow |
|
|---|
| ChTry MSlow |
|
|---|
| ArgC MSlow |
|
|---|
| LysN MSlow |
|
|---|
| TryLysC MSlow |
|
|---|
| Try MShigh |
|
|---|
| ChTry MShigh |
|
|---|
| ArgC MShigh |
|
|---|
| LysN MShigh |
|
|---|
| TryLysC MShigh |
|
|---|
General Statistics
Number of major isoforms |
Number of additional isoforms |
Number of all proteins |
Number of amino acids |
Min. Seq. Length |
Max. Seq. Length |
Avg. Seq. Length |
Avg. Mol. Weight |
|---|---|---|---|---|---|---|---|
0 |
1920618 |
29 |
10286 |
343.2 |
37.65 |
Amino acid frequency
Ala |
Cys |
Asp |
Glu |
Phe |
Gly |
His |
Ile |
Lys |
Leu |
|---|---|---|---|---|---|---|---|---|---|
10.854 ± 0.038 | 0.972 ± 0.01 |
5.284 ± 0.025 | 5.671 ± 0.033 |
3.626 ± 0.021 | 7.893 ± 0.04 |
2.295 ± 0.019 | 4.76 ± 0.026 |
3.342 ± 0.035 | 12.018 ± 0.047 |
Met |
Asn |
Gln |
Pro |
Arg |
Ser |
Thr |
Val |
Trp |
Tyr |
|---|---|---|---|---|---|---|---|---|---|
2.212 ± 0.019 | 3.065 ± 0.029 |
4.873 ± 0.03 | 4.74 ± 0.033 |
6.469 ± 0.03 | 6.052 ± 0.029 |
4.849 ± 0.029 | 7.094 ± 0.029 |
1.417 ± 0.015 | 2.515 ± 0.017 |
Most of the basic statistics you can see at this page can be downloaded from this CSV file
See this proteome in:

Proteome-pI is available under Creative Commons Attribution-NoDerivs license, for more details see here
| Reference: Kozlowski LP. Proteome-pI 2.0: Proteome Isoelectric Point Database Update. Nucleic Acids Res. 2021, doi: 10.1093/nar/gkab944 | Contact: Lukasz P. Kozlowski |