Streptococcus phage Javan583
Taxonomy: Viruses; Duplodnaviria; Heunggongvirae; Uroviricota; Caudoviricetes; Caudovirales; Siphoviridae; unclassified Siphoviridae
Average proteome isoelectric point is 6.62
Get precalculated fractions of proteins
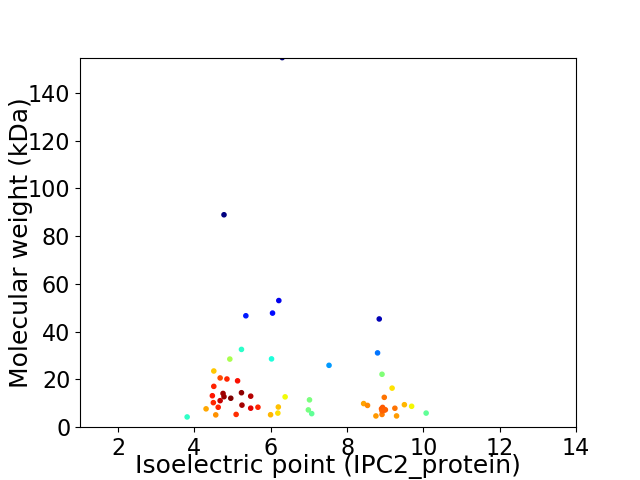
Virtual 2D-PAGE plot for 57 proteins (isoelectric point calculated using IPC2_protein)
Get csv file with sequences according to given criteria:
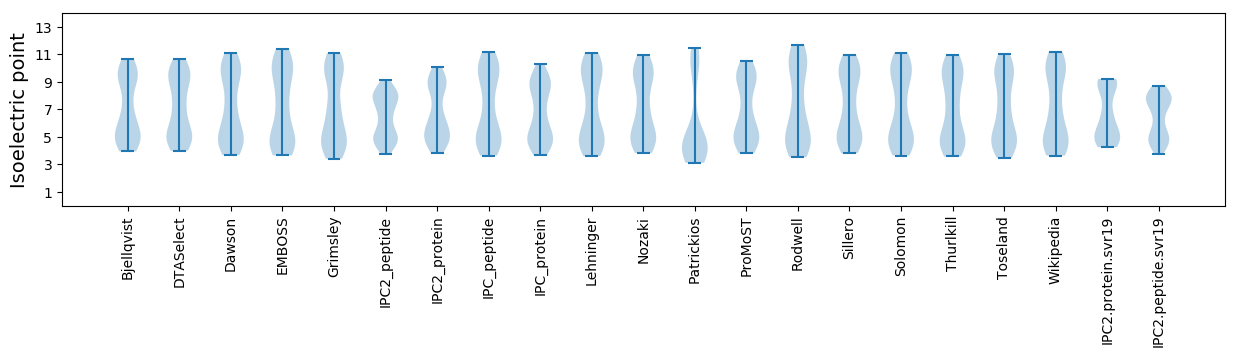
* You can choose from 21 different methods for calculating isoelectric point
Summary statistics related to proteome-wise predictions
Protein with the lowest isoelectric point:
>tr|A0A4D6AJM9|A0A4D6AJM9_9CAUD Uncharacterized protein OS=Streptococcus phage Javan583 OX=2548273 GN=Javan583_0044 PE=4 SV=1
MM1 pKa = 7.17QFDD4 pKa = 3.89EE5 pKa = 5.04VIEE8 pKa = 4.64FNDD11 pKa = 3.32EE12 pKa = 4.16LYY14 pKa = 10.82QKK16 pKa = 10.78NIADD20 pKa = 3.7HH21 pKa = 6.52TFPEE25 pKa = 5.29IDD27 pKa = 4.23DD28 pKa = 4.62LDD30 pKa = 4.41GKK32 pKa = 11.21GGTNEE37 pKa = 3.71
MM1 pKa = 7.17QFDD4 pKa = 3.89EE5 pKa = 5.04VIEE8 pKa = 4.64FNDD11 pKa = 3.32EE12 pKa = 4.16LYY14 pKa = 10.82QKK16 pKa = 10.78NIADD20 pKa = 3.7HH21 pKa = 6.52TFPEE25 pKa = 5.29IDD27 pKa = 4.23DD28 pKa = 4.62LDD30 pKa = 4.41GKK32 pKa = 11.21GGTNEE37 pKa = 3.71
Molecular weight: 4.29 kDa
Isoelectric point according different methods:
Protein with the highest isoelectric point:
>tr|A0A4D6AJX1|A0A4D6AJX1_9CAUD Uncharacterized protein OS=Streptococcus phage Javan583 OX=2548273 GN=Javan583_0022 PE=4 SV=1
MM1 pKa = 7.71AKK3 pKa = 10.24NGAKK7 pKa = 10.32GGGRR11 pKa = 11.84HH12 pKa = 5.47GAVKK16 pKa = 10.34GRR18 pKa = 11.84SQSYY22 pKa = 9.31NPKK25 pKa = 8.86TGLYY29 pKa = 7.82TKK31 pKa = 10.46RR32 pKa = 11.84NTSTGKK38 pKa = 10.51FMDD41 pKa = 3.49VKK43 pKa = 8.92TTGGKK48 pKa = 9.72FKK50 pKa = 11.02GVTSEE55 pKa = 4.15KK56 pKa = 10.95
MM1 pKa = 7.71AKK3 pKa = 10.24NGAKK7 pKa = 10.32GGGRR11 pKa = 11.84HH12 pKa = 5.47GAVKK16 pKa = 10.34GRR18 pKa = 11.84SQSYY22 pKa = 9.31NPKK25 pKa = 8.86TGLYY29 pKa = 7.82TKK31 pKa = 10.46RR32 pKa = 11.84NTSTGKK38 pKa = 10.51FMDD41 pKa = 3.49VKK43 pKa = 8.92TTGGKK48 pKa = 9.72FKK50 pKa = 11.02GVTSEE55 pKa = 4.15KK56 pKa = 10.95
Molecular weight: 5.91 kDa
Isoelectric point according different methods:
Peptides (in silico digests for buttom-up proteomics)
Below you can find in silico digests of the whole proteome with Trypsin, Chymotrypsin, Trypsin+LysC, LysN, ArgC proteases suitable for different mass spec machines.| Try ESI |
 |
|---|
| ChTry ESI |
|
|---|
| ArgC ESI |
|
|---|
| LysN ESI |
|
|---|
| TryLysC ESI |
|
|---|
| Try MALDI |
|
|---|
| ChTry MALDI |
|
|---|
| ArgC MALDI |
|
|---|
| LysN MALDI |
|
|---|
| TryLysC MALDI |
|
|---|
| Try LTQ |
|
|---|
| ChTry LTQ |
|
|---|
| ArgC LTQ |
|
|---|
| LysN LTQ |
|
|---|
| TryLysC LTQ |
|
|---|
| Try MSlow |
|
|---|
| ChTry MSlow |
|
|---|
| ArgC MSlow |
|
|---|
| LysN MSlow |
|
|---|
| TryLysC MSlow |
|
|---|
| Try MShigh |
|
|---|
| ChTry MShigh |
|
|---|
| ArgC MShigh |
|
|---|
| LysN MShigh |
|
|---|
| TryLysC MShigh |
|
|---|
General Statistics
Number of major isoforms |
Number of additional isoforms |
Number of all proteins |
Number of amino acids |
Min. Seq. Length |
Max. Seq. Length |
Avg. Seq. Length |
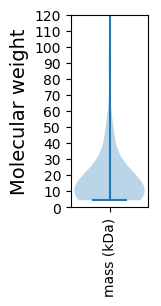
Avg. Mol. Weight |
|---|---|---|---|---|---|---|---|
0 |
9404 |
37 |
1387 |
165.0 |
18.59 |
Amino acid frequency
Ala |
Cys |
Asp |
Glu |
Phe |
Gly |
His |
Ile |
Lys |
Leu |
|---|---|---|---|---|---|---|---|---|---|
7.401 ± 0.556 | 0.5 ± 0.108 |
5.859 ± 0.266 | 7.21 ± 0.543 |
3.86 ± 0.216 | 6.933 ± 0.577 |
1.404 ± 0.173 | 6.699 ± 0.301 |
7.614 ± 0.487 | 8.55 ± 0.425 |
Met |
Asn |
Gln |
Pro |
Arg |
Ser |
Thr |
Val |
Trp |
Tyr |
|---|---|---|---|---|---|---|---|---|---|
2.69 ± 0.242 | 5.296 ± 0.346 |
2.882 ± 0.289 | 4.381 ± 0.309 |
4.849 ± 0.368 | 6.114 ± 0.475 |
6.285 ± 0.406 | 6.402 ± 0.303 |
1.223 ± 0.121 | 3.849 ± 0.297 |
Most of the basic statistics you can see at this page can be downloaded from this CSV file
See this proteome in:

Proteome-pI is available under Creative Commons Attribution-NoDerivs license, for more details see here
| Reference: Kozlowski LP. Proteome-pI 2.0: Proteome Isoelectric Point Database Update. Nucleic Acids Res. 2021, doi: 10.1093/nar/gkab944 | Contact: Lukasz P. Kozlowski |