Arthrobacter phage Noely
Taxonomy: Viruses; Duplodnaviria; Heunggongvirae; Uroviricota; Caudoviricetes; Caudovirales; Siphoviridae; unclassified Siphoviridae
Average proteome isoelectric point is 6.55
Get precalculated fractions of proteins
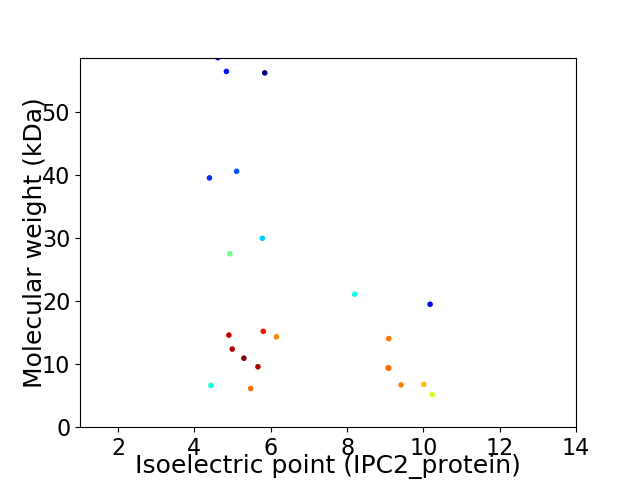
Virtual 2D-PAGE plot for 23 proteins (isoelectric point calculated using IPC2_protein)
Get csv file with sequences according to given criteria:
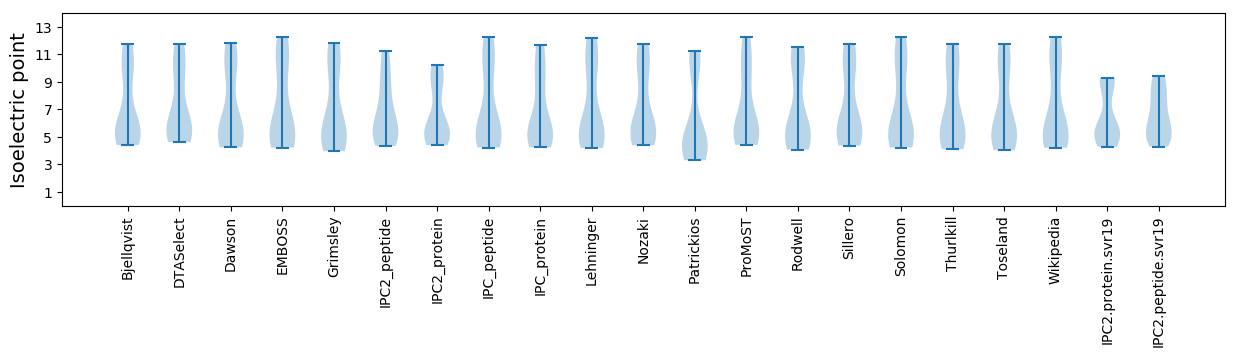
* You can choose from 21 different methods for calculating isoelectric point
Summary statistics related to proteome-wise predictions
Protein with the lowest isoelectric point:
>tr|A0A3G2KAD4|A0A3G2KAD4_9CAUD Minor tail protein OS=Arthrobacter phage Noely OX=2419964 GN=12 PE=4 SV=1
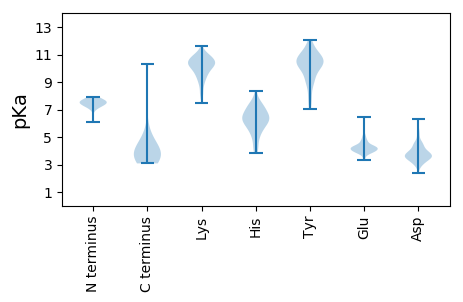
MM1 pKa = 7.62KK2 pKa = 10.03EE3 pKa = 4.09HH4 pKa = 6.98GSLAPWPDD12 pKa = 4.09CLCGGPSWQEE22 pKa = 4.02CQDD25 pKa = 3.47GLAATARR32 pKa = 11.84AAGPPDD38 pKa = 4.33PPPLVTLVDD47 pKa = 3.67QARR50 pKa = 11.84IDD52 pKa = 3.64YY53 pKa = 8.97LFWRR57 pKa = 11.84GFDD60 pKa = 3.35TT61 pKa = 5.43
MM1 pKa = 7.62KK2 pKa = 10.03EE3 pKa = 4.09HH4 pKa = 6.98GSLAPWPDD12 pKa = 4.09CLCGGPSWQEE22 pKa = 4.02CQDD25 pKa = 3.47GLAATARR32 pKa = 11.84AAGPPDD38 pKa = 4.33PPPLVTLVDD47 pKa = 3.67QARR50 pKa = 11.84IDD52 pKa = 3.64YY53 pKa = 8.97LFWRR57 pKa = 11.84GFDD60 pKa = 3.35TT61 pKa = 5.43
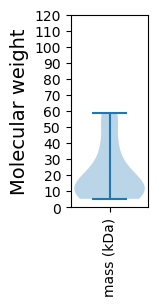
Molecular weight: 6.63 kDa
Isoelectric point according different methods:
Protein with the highest isoelectric point:
>tr|A0A3G2KAF2|A0A3G2KAF2_9CAUD Helix-turn-helix DNA binding domain protein OS=Arthrobacter phage Noely OX=2419964 GN=3 PE=4 SV=1
MM1 pKa = 7.49NIKK4 pKa = 8.96PTDD7 pKa = 3.25KK8 pKa = 10.15MAAAGTGGAAALLLQWGARR27 pKa = 11.84QAGLDD32 pKa = 4.03LPPDD36 pKa = 3.42VAAAFVLVAAFVAGWLRR53 pKa = 11.84TEE55 pKa = 4.35GGRR58 pKa = 11.84RR59 pKa = 11.84EE60 pKa = 4.06GRR62 pKa = 11.84HH63 pKa = 5.59RR64 pKa = 11.84GG65 pKa = 3.39
MM1 pKa = 7.49NIKK4 pKa = 8.96PTDD7 pKa = 3.25KK8 pKa = 10.15MAAAGTGGAAALLLQWGARR27 pKa = 11.84QAGLDD32 pKa = 4.03LPPDD36 pKa = 3.42VAAAFVLVAAFVAGWLRR53 pKa = 11.84TEE55 pKa = 4.35GGRR58 pKa = 11.84RR59 pKa = 11.84EE60 pKa = 4.06GRR62 pKa = 11.84HH63 pKa = 5.59RR64 pKa = 11.84GG65 pKa = 3.39
Molecular weight: 6.71 kDa
Isoelectric point according different methods:
Peptides (in silico digests for buttom-up proteomics)
Below you can find in silico digests of the whole proteome with Trypsin, Chymotrypsin, Trypsin+LysC, LysN, ArgC proteases suitable for different mass spec machines.| Try ESI |
 |
|---|
| ChTry ESI |
|
|---|
| ArgC ESI |
|
|---|
| LysN ESI |
|
|---|
| TryLysC ESI |
|
|---|
| Try MALDI |
|
|---|
| ChTry MALDI |
|
|---|
| ArgC MALDI |
|
|---|
| LysN MALDI |
|
|---|
| TryLysC MALDI |
|
|---|
| Try LTQ |
|
|---|
| ChTry LTQ |
|
|---|
| ArgC LTQ |
|
|---|
| LysN LTQ |
|
|---|
| TryLysC LTQ |
|
|---|
| Try MSlow |
|
|---|
| ChTry MSlow |
|
|---|
| ArgC MSlow |
|
|---|
| LysN MSlow |
|
|---|
| TryLysC MSlow |
|
|---|
| Try MShigh |
|
|---|
| ChTry MShigh |
|
|---|
| ArgC MShigh |
|
|---|
| LysN MShigh |
|
|---|
| TryLysC MShigh |
|
|---|
General Statistics
Number of major isoforms |
Number of additional isoforms |
Number of all proteins |
Number of amino acids |
Min. Seq. Length |
Max. Seq. Length |
Avg. Seq. Length |
Avg. Mol. Weight |
|---|---|---|---|---|---|---|---|
0 |
4603 |
47 |
558 |
200.1 |
21.35 |
Amino acid frequency
Ala |
Cys |
Asp |
Glu |
Phe |
Gly |
His |
Ile |
Lys |
Leu |
|---|---|---|---|---|---|---|---|---|---|
14.86 ± 0.599 | 0.608 ± 0.164 |
6.691 ± 0.328 | 5.301 ± 0.553 |
1.955 ± 0.126 | 9.255 ± 0.398 |
1.369 ± 0.205 | 2.955 ± 0.323 |
4.236 ± 0.445 | 8.799 ± 0.412 |
Met |
Asn |
Gln |
Pro |
Arg |
Ser |
Thr |
Val |
Trp |
Tyr |
|---|---|---|---|---|---|---|---|---|---|
2.151 ± 0.262 | 2.911 ± 0.332 |
5.279 ± 0.582 | 3.91 ± 0.302 |
6.604 ± 0.566 | 4.541 ± 0.316 |
6.517 ± 0.369 | 8.038 ± 0.493 |
1.825 ± 0.192 | 2.194 ± 0.216 |
Most of the basic statistics you can see at this page can be downloaded from this CSV file
See this proteome in:

Proteome-pI is available under Creative Commons Attribution-NoDerivs license, for more details see here
| Reference: Kozlowski LP. Proteome-pI 2.0: Proteome Isoelectric Point Database Update. Nucleic Acids Res. 2021, doi: 10.1093/nar/gkab944 | Contact: Lukasz P. Kozlowski |