Saccharopolyspora shandongensis
Taxonomy: cellular organisms; Bacteria; Terrabacteria group; Actinobacteria; Actinomycetia; Pseudonocardiales; Pseudonocardiaceae; Saccharopolyspora
Average proteome isoelectric point is 6.21
Get precalculated fractions of proteins
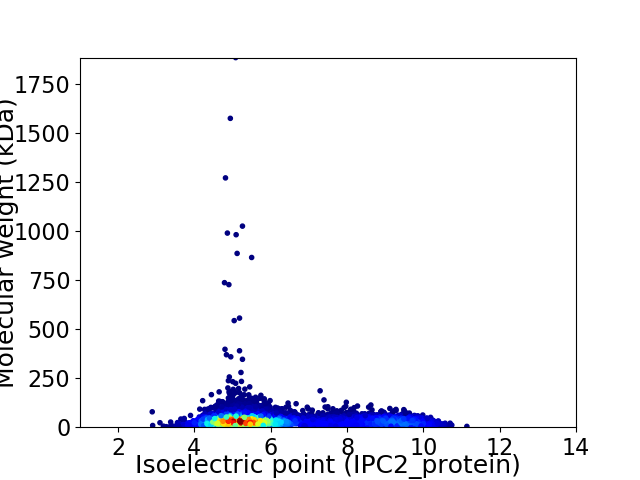
Virtual 2D-PAGE plot for 9219 proteins (isoelectric point calculated using IPC2_protein)
Get csv file with sequences according to given criteria:
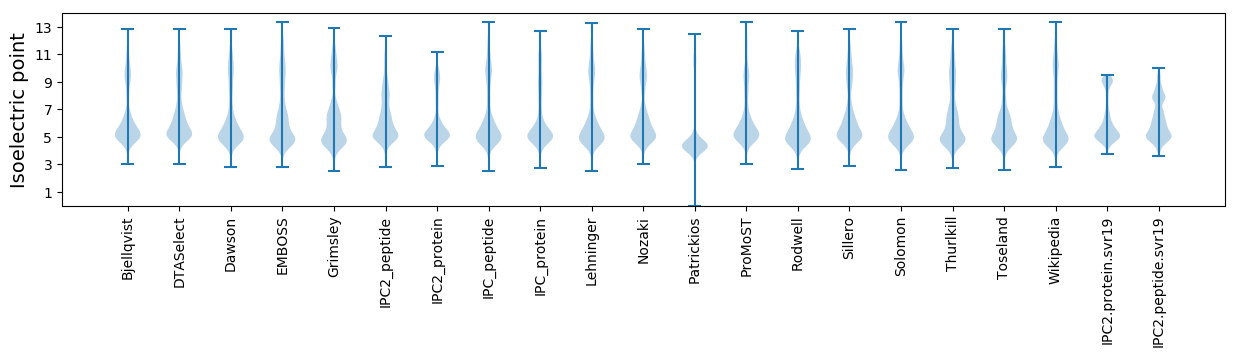
* You can choose from 21 different methods for calculating isoelectric point
Summary statistics related to proteome-wise predictions
Protein with the lowest isoelectric point:
>tr|A0A1H3MJL6|A0A1H3MJL6_9PSEU Assimilatory sulfite reductase (ferredoxin) OS=Saccharopolyspora shandongensis OX=418495 GN=SAMN05216215_103465 PE=4 SV=1
MM1 pKa = 7.36SWTIEE6 pKa = 3.89VDD8 pKa = 2.92ADD10 pKa = 3.79TCIGSGMCAGVAPDD24 pKa = 3.89HH25 pKa = 6.73FEE27 pKa = 4.39LVDD30 pKa = 4.1GYY32 pKa = 11.73GCARR36 pKa = 11.84KK37 pKa = 9.16AAVEE41 pKa = 4.02PADD44 pKa = 3.7QVIDD48 pKa = 3.72AAEE51 pKa = 4.26SCPVEE56 pKa = 4.8AILVKK61 pKa = 10.74DD62 pKa = 3.78ADD64 pKa = 4.13TGDD67 pKa = 3.44VVAPEE72 pKa = 4.07EE73 pKa = 4.11
MM1 pKa = 7.36SWTIEE6 pKa = 3.89VDD8 pKa = 2.92ADD10 pKa = 3.79TCIGSGMCAGVAPDD24 pKa = 3.89HH25 pKa = 6.73FEE27 pKa = 4.39LVDD30 pKa = 4.1GYY32 pKa = 11.73GCARR36 pKa = 11.84KK37 pKa = 9.16AAVEE41 pKa = 4.02PADD44 pKa = 3.7QVIDD48 pKa = 3.72AAEE51 pKa = 4.26SCPVEE56 pKa = 4.8AILVKK61 pKa = 10.74DD62 pKa = 3.78ADD64 pKa = 4.13TGDD67 pKa = 3.44VVAPEE72 pKa = 4.07EE73 pKa = 4.11
Molecular weight: 7.53 kDa
Isoelectric point according different methods:
Protein with the highest isoelectric point:
>tr|A0A1H3JCZ3|A0A1H3JCZ3_9PSEU Cytochrome c biogenesis protein OS=Saccharopolyspora shandongensis OX=418495 GN=SAMN05216215_1025113 PE=4 SV=1
MM1 pKa = 7.4GSVIKK6 pKa = 10.38KK7 pKa = 8.42RR8 pKa = 11.84RR9 pKa = 11.84KK10 pKa = 9.06RR11 pKa = 11.84MSKK14 pKa = 9.76KK15 pKa = 9.54KK16 pKa = 9.79HH17 pKa = 5.67RR18 pKa = 11.84KK19 pKa = 8.46LLRR22 pKa = 11.84KK23 pKa = 7.95TRR25 pKa = 11.84VQRR28 pKa = 11.84RR29 pKa = 11.84KK30 pKa = 10.07LGKK33 pKa = 9.87
MM1 pKa = 7.4GSVIKK6 pKa = 10.38KK7 pKa = 8.42RR8 pKa = 11.84RR9 pKa = 11.84KK10 pKa = 9.06RR11 pKa = 11.84MSKK14 pKa = 9.76KK15 pKa = 9.54KK16 pKa = 9.79HH17 pKa = 5.67RR18 pKa = 11.84KK19 pKa = 8.46LLRR22 pKa = 11.84KK23 pKa = 7.95TRR25 pKa = 11.84VQRR28 pKa = 11.84RR29 pKa = 11.84KK30 pKa = 10.07LGKK33 pKa = 9.87
Molecular weight: 4.12 kDa
Isoelectric point according different methods:
Peptides (in silico digests for buttom-up proteomics)
Below you can find in silico digests of the whole proteome with Trypsin, Chymotrypsin, Trypsin+LysC, LysN, ArgC proteases suitable for different mass spec machines.| Try ESI |
 |
|---|
| ChTry ESI |
|
|---|
| ArgC ESI |
|
|---|
| LysN ESI |
|
|---|
| TryLysC ESI |
|
|---|
| Try MALDI |
|
|---|
| ChTry MALDI |
|
|---|
| ArgC MALDI |
|
|---|
| LysN MALDI |
|
|---|
| TryLysC MALDI |
|
|---|
| Try LTQ |
|
|---|
| ChTry LTQ |
|
|---|
| ArgC LTQ |
|
|---|
| LysN LTQ |
|
|---|
| TryLysC LTQ |
|
|---|
| Try MSlow |
|
|---|
| ChTry MSlow |
|
|---|
| ArgC MSlow |
|
|---|
| LysN MSlow |
|
|---|
| TryLysC MSlow |
|
|---|
| Try MShigh |
|
|---|
| ChTry MShigh |
|
|---|
| ArgC MShigh |
|
|---|
| LysN MShigh |
|
|---|
| TryLysC MShigh |
|
|---|
General Statistics
Number of major isoforms |
Number of additional isoforms |
Number of all proteins |
Number of amino acids |
Min. Seq. Length |
Max. Seq. Length |
Avg. Seq. Length |
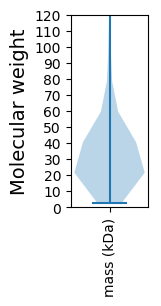
Avg. Mol. Weight |
|---|---|---|---|---|---|---|---|
0 |
2930089 |
24 |
17456 |
317.8 |
34.17 |
Amino acid frequency
Ala |
Cys |
Asp |
Glu |
Phe |
Gly |
His |
Ile |
Lys |
Leu |
|---|---|---|---|---|---|---|---|---|---|
13.188 ± 0.038 | 0.811 ± 0.012 |
6.036 ± 0.025 | 5.899 ± 0.03 |
2.949 ± 0.017 | 9.115 ± 0.025 |
2.286 ± 0.017 | 3.691 ± 0.02 |
1.972 ± 0.017 | 10.407 ± 0.035 |
Met |
Asn |
Gln |
Pro |
Arg |
Ser |
Thr |
Val |
Trp |
Tyr |
|---|---|---|---|---|---|---|---|---|---|
1.831 ± 0.013 | 1.978 ± 0.013 |
5.896 ± 0.024 | 3.117 ± 0.02 |
7.976 ± 0.031 | 5.224 ± 0.026 |
5.592 ± 0.024 | 8.597 ± 0.03 |
1.531 ± 0.011 | 1.903 ± 0.012 |
Most of the basic statistics you can see at this page can be downloaded from this CSV file
See this proteome in:

Proteome-pI is available under Creative Commons Attribution-NoDerivs license, for more details see here
| Reference: Kozlowski LP. Proteome-pI 2.0: Proteome Isoelectric Point Database Update. Nucleic Acids Res. 2021, doi: 10.1093/nar/gkab944 | Contact: Lukasz P. Kozlowski |