Bacillus phage Gamma
Taxonomy: Viruses; Duplodnaviria; Heunggongvirae; Uroviricota; Caudoviricetes; Caudovirales; Siphoviridae; Wbetavirus; unclassified Wbetavirus
Average proteome isoelectric point is 6.56
Get precalculated fractions of proteins
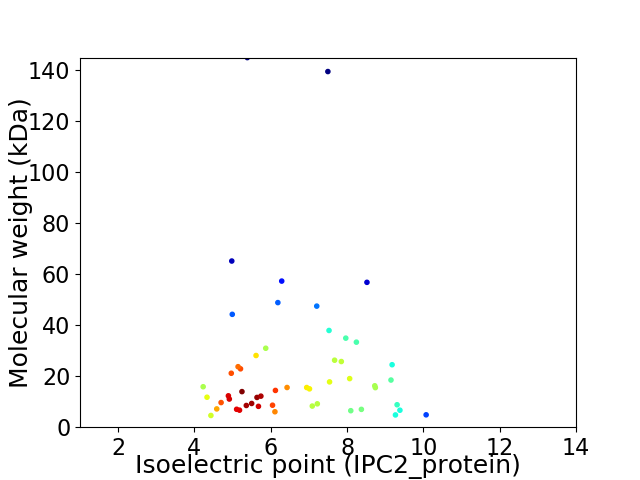
Virtual 2D-PAGE plot for 53 proteins (isoelectric point calculated using IPC2_protein)
Get csv file with sequences according to given criteria:
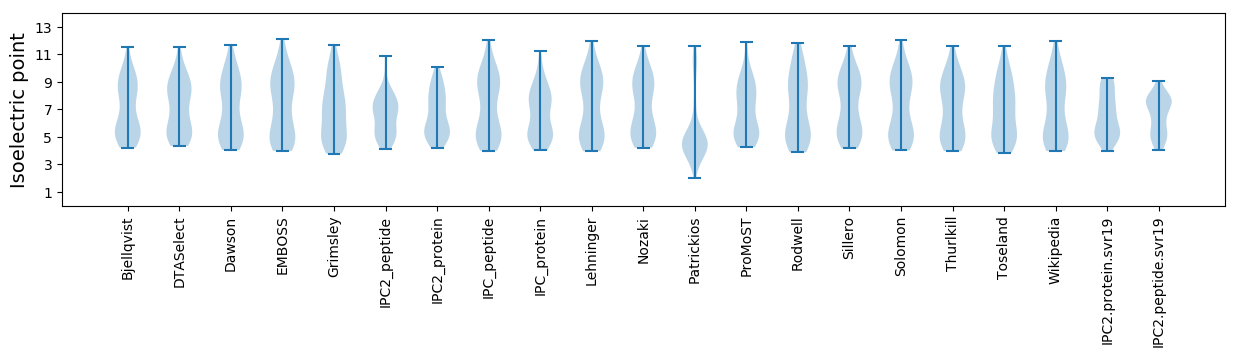
* You can choose from 21 different methods for calculating isoelectric point
Summary statistics related to proteome-wise predictions
Protein with the lowest isoelectric point:
>tr|Q3HKZ5|Q3HKZ5_9CAUD Putative phage regulatory protein OS=Bacillus phage Gamma OX=347962 GN=GAMMALSU_0024 PE=4 SV=1
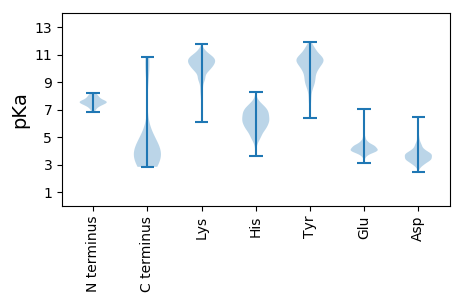
MM1 pKa = 7.19NRR3 pKa = 11.84VNDD6 pKa = 3.8YY7 pKa = 11.02FGLEE11 pKa = 4.22SKK13 pKa = 10.61SDD15 pKa = 4.29CIWFYY20 pKa = 11.51GFFSISTILFLIDD33 pKa = 4.04MIIALII39 pKa = 3.93
MM1 pKa = 7.19NRR3 pKa = 11.84VNDD6 pKa = 3.8YY7 pKa = 11.02FGLEE11 pKa = 4.22SKK13 pKa = 10.61SDD15 pKa = 4.29CIWFYY20 pKa = 11.51GFFSISTILFLIDD33 pKa = 4.04MIIALII39 pKa = 3.93
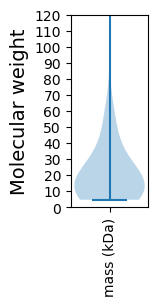
Molecular weight: 4.6 kDa
Isoelectric point according different methods:
Protein with the highest isoelectric point:
>tr|Q3HKZ2|Q3HKZ2_9CAUD Site-specific recombinase OS=Bacillus phage Gamma OX=347962 GN=GAMMALSU_0027 PE=4 SV=1
MM1 pKa = 7.57IIVEE5 pKa = 4.46FKK7 pKa = 10.96DD8 pKa = 3.18RR9 pKa = 11.84LRR11 pKa = 11.84QLRR14 pKa = 11.84RR15 pKa = 11.84EE16 pKa = 4.16RR17 pKa = 11.84NLTQHH22 pKa = 7.28DD23 pKa = 4.44LGQAIGVTAGSITVTNNQLL42 pKa = 3.04
MM1 pKa = 7.57IIVEE5 pKa = 4.46FKK7 pKa = 10.96DD8 pKa = 3.18RR9 pKa = 11.84LRR11 pKa = 11.84QLRR14 pKa = 11.84RR15 pKa = 11.84EE16 pKa = 4.16RR17 pKa = 11.84NLTQHH22 pKa = 7.28DD23 pKa = 4.44LGQAIGVTAGSITVTNNQLL42 pKa = 3.04
Molecular weight: 4.81 kDa
Isoelectric point according different methods:
Peptides (in silico digests for buttom-up proteomics)
Below you can find in silico digests of the whole proteome with Trypsin, Chymotrypsin, Trypsin+LysC, LysN, ArgC proteases suitable for different mass spec machines.| Try ESI |
 |
|---|
| ChTry ESI |
|
|---|
| ArgC ESI |
|
|---|
| LysN ESI |
|
|---|
| TryLysC ESI |
|
|---|
| Try MALDI |
|
|---|
| ChTry MALDI |
|
|---|
| ArgC MALDI |
|
|---|
| LysN MALDI |
|
|---|
| TryLysC MALDI |
|
|---|
| Try LTQ |
|
|---|
| ChTry LTQ |
|
|---|
| ArgC LTQ |
|
|---|
| LysN LTQ |
|
|---|
| TryLysC LTQ |
|
|---|
| Try MSlow |
|
|---|
| ChTry MSlow |
|
|---|
| ArgC MSlow |
|
|---|
| LysN MSlow |
|
|---|
| TryLysC MSlow |
|
|---|
| Try MShigh |
|
|---|
| ChTry MShigh |
|
|---|
| ArgC MShigh |
|
|---|
| LysN MShigh |
|
|---|
| TryLysC MShigh |
|
|---|
General Statistics
Number of major isoforms |
Number of additional isoforms |
Number of all proteins |
Number of amino acids |
Min. Seq. Length |
Max. Seq. Length |
Avg. Seq. Length |
Avg. Mol. Weight |
|---|---|---|---|---|---|---|---|
0 |
11221 |
39 |
1288 |
211.7 |
24.19 |
Amino acid frequency
Ala |
Cys |
Asp |
Glu |
Phe |
Gly |
His |
Ile |
Lys |
Leu |
|---|---|---|---|---|---|---|---|---|---|
6.417 ± 0.583 | 0.775 ± 0.169 |
5.811 ± 0.256 | 8.894 ± 0.29 |
3.903 ± 0.205 | 5.917 ± 0.306 |
1.622 ± 0.229 | 6.916 ± 0.259 |
9.589 ± 0.391 | 8.448 ± 0.34 |
Met |
Asn |
Gln |
Pro |
Arg |
Ser |
Thr |
Val |
Trp |
Tyr |
|---|---|---|---|---|---|---|---|---|---|
2.745 ± 0.161 | 5.383 ± 0.215 |
2.558 ± 0.252 | 4.171 ± 0.333 |
4.741 ± 0.225 | 5.713 ± 0.296 |
5.534 ± 0.308 | 6.176 ± 0.207 |
1.221 ± 0.175 | 3.467 ± 0.236 |
Most of the basic statistics you can see at this page can be downloaded from this CSV file
See this proteome in:

Proteome-pI is available under Creative Commons Attribution-NoDerivs license, for more details see here
| Reference: Kozlowski LP. Proteome-pI 2.0: Proteome Isoelectric Point Database Update. Nucleic Acids Res. 2021, doi: 10.1093/nar/gkab944 | Contact: Lukasz P. Kozlowski |