Ralstonia phage p12J
Taxonomy: Viruses; Monodnaviria; Loebvirae; Hofneiviricota; Faserviricetes; Tubulavirales; Inoviridae; unclassified Inoviridae
Average proteome isoelectric point is 7.37
Get precalculated fractions of proteins
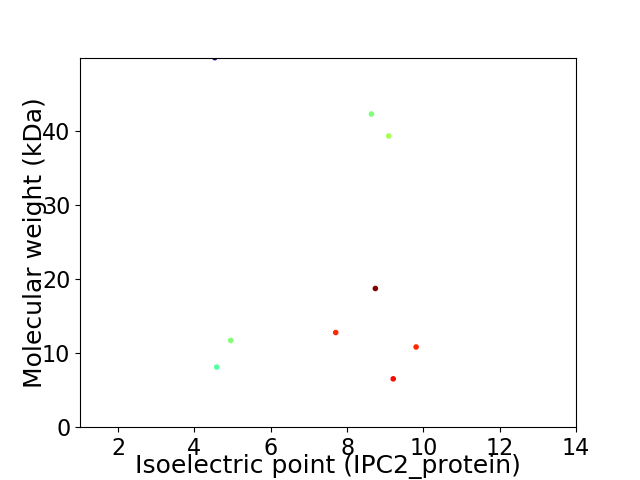
Virtual 2D-PAGE plot for 9 proteins (isoelectric point calculated using IPC2_protein)
Get csv file with sequences according to given criteria:
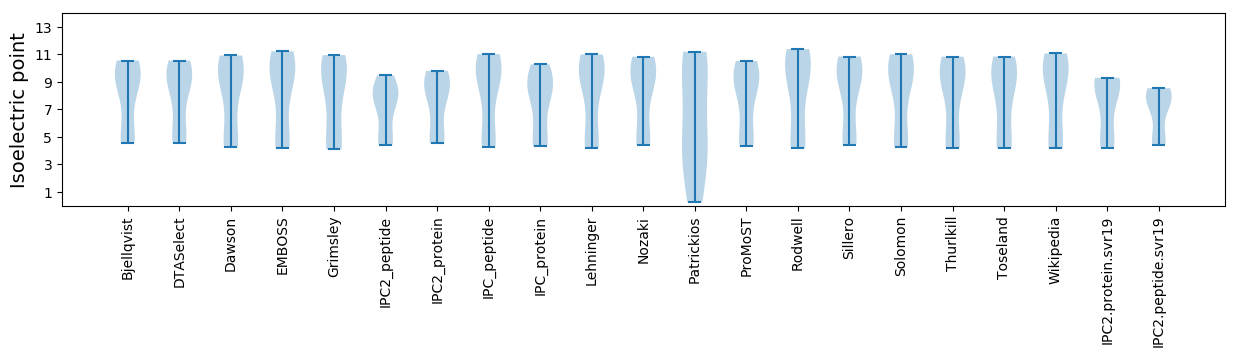
* You can choose from 21 different methods for calculating isoelectric point
Summary statistics related to proteome-wise predictions
Protein with the lowest isoelectric point:
>tr|Q6UAZ7|Q6UAZ7_9VIRU Putative minor coat protein OS=Ralstonia phage p12J OX=247080 PE=4 SV=1
MM1 pKa = 7.01AQCVQIVSGQFQLDD15 pKa = 3.29SAAASSCTGYY25 pKa = 11.29LLLTADD31 pKa = 4.33EE32 pKa = 4.55VTLLHH37 pKa = 6.75AVPPLSVSDD46 pKa = 3.8GALIGSGMLGLWALAFVFRR65 pKa = 11.84SAARR69 pKa = 11.84AIYY72 pKa = 9.78QRR74 pKa = 11.84EE75 pKa = 4.05EE76 pKa = 3.78EE77 pKa = 4.22
MM1 pKa = 7.01AQCVQIVSGQFQLDD15 pKa = 3.29SAAASSCTGYY25 pKa = 11.29LLLTADD31 pKa = 4.33EE32 pKa = 4.55VTLLHH37 pKa = 6.75AVPPLSVSDD46 pKa = 3.8GALIGSGMLGLWALAFVFRR65 pKa = 11.84SAARR69 pKa = 11.84AIYY72 pKa = 9.78QRR74 pKa = 11.84EE75 pKa = 4.05EE76 pKa = 3.78EE77 pKa = 4.22
Molecular weight: 8.12 kDa
Isoelectric point according different methods:
Protein with the highest isoelectric point:
>tr|Q6UAZ4|Q6UAZ4_9VIRU Putative minor coat protein OS=Ralstonia phage p12J OX=247080 PE=4 SV=1
MM1 pKa = 7.66PFAALLASAIVGFLAQACVSLVGRR25 pKa = 11.84VLVALGIGFVMFTGVDD41 pKa = 3.21AMMTGMKK48 pKa = 9.07TLFMQYY54 pKa = 10.52VNGIGSISSVSVVGILGVLKK74 pKa = 10.81VGTSMNMILTTLGIRR89 pKa = 11.84ASLSGLSGGSIRR101 pKa = 11.84KK102 pKa = 7.94MVQKK106 pKa = 10.87
MM1 pKa = 7.66PFAALLASAIVGFLAQACVSLVGRR25 pKa = 11.84VLVALGIGFVMFTGVDD41 pKa = 3.21AMMTGMKK48 pKa = 9.07TLFMQYY54 pKa = 10.52VNGIGSISSVSVVGILGVLKK74 pKa = 10.81VGTSMNMILTTLGIRR89 pKa = 11.84ASLSGLSGGSIRR101 pKa = 11.84KK102 pKa = 7.94MVQKK106 pKa = 10.87
Molecular weight: 10.83 kDa
Isoelectric point according different methods:
Peptides (in silico digests for buttom-up proteomics)
Below you can find in silico digests of the whole proteome with Trypsin, Chymotrypsin, Trypsin+LysC, LysN, ArgC proteases suitable for different mass spec machines.| Try ESI |
 |
|---|
| ChTry ESI |
|
|---|
| ArgC ESI |
|
|---|
| LysN ESI |
|
|---|
| TryLysC ESI |
|
|---|
| Try MALDI |
|
|---|
| ChTry MALDI |
|
|---|
| ArgC MALDI |
|
|---|
| LysN MALDI |
|
|---|
| TryLysC MALDI |
|
|---|
| Try LTQ |
|
|---|
| ChTry LTQ |
|
|---|
| ArgC LTQ |
|
|---|
| LysN LTQ |
|
|---|
| TryLysC LTQ |
|
|---|
| Try MSlow |
|
|---|
| ChTry MSlow |
|
|---|
| ArgC MSlow |
|
|---|
| LysN MSlow |
|
|---|
| TryLysC MSlow |
|
|---|
| Try MShigh |
|
|---|
| ChTry MShigh |
|
|---|
| ArgC MShigh |
|
|---|
| LysN MShigh |
|
|---|
| TryLysC MShigh |
|
|---|
General Statistics
Number of major isoforms |
Number of additional isoforms |
Number of all proteins |
Number of amino acids |
Min. Seq. Length |
Max. Seq. Length |
Avg. Seq. Length |
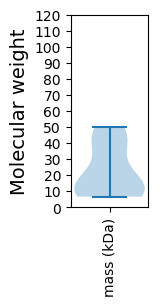
Avg. Mol. Weight |
|---|---|---|---|---|---|---|---|
0 |
1846 |
67 |
488 |
205.1 |
22.24 |
Amino acid frequency
Ala |
Cys |
Asp |
Glu |
Phe |
Gly |
His |
Ile |
Lys |
Leu |
|---|---|---|---|---|---|---|---|---|---|
9.913 ± 0.938 | 2.275 ± 0.826 |
5.309 ± 0.776 | 4.55 ± 1.37 |
3.413 ± 0.684 | 9.317 ± 1.126 |
2.113 ± 0.529 | 3.467 ± 0.433 |
4.767 ± 0.997 | 7.042 ± 0.896 |
Met |
Asn |
Gln |
Pro |
Arg |
Ser |
Thr |
Val |
Trp |
Tyr |
|---|---|---|---|---|---|---|---|---|---|
2.817 ± 0.527 | 2.817 ± 0.833 |
5.959 ± 1.26 | 4.442 ± 0.618 |
6.392 ± 1.644 | 6.988 ± 1.286 |
5.634 ± 0.795 | 8.776 ± 0.725 |
1.517 ± 0.251 | 2.492 ± 0.265 |
Most of the basic statistics you can see at this page can be downloaded from this CSV file
See this proteome in:

Proteome-pI is available under Creative Commons Attribution-NoDerivs license, for more details see here
| Reference: Kozlowski LP. Proteome-pI 2.0: Proteome Isoelectric Point Database Update. Nucleic Acids Res. 2021, doi: 10.1093/nar/gkab944 | Contact: Lukasz P. Kozlowski |