Thermoflavimicrobium dichotomicum
Taxonomy: cellular organisms; Bacteria; Terrabacteria group;
Average proteome isoelectric point is 6.73
Get precalculated fractions of proteins
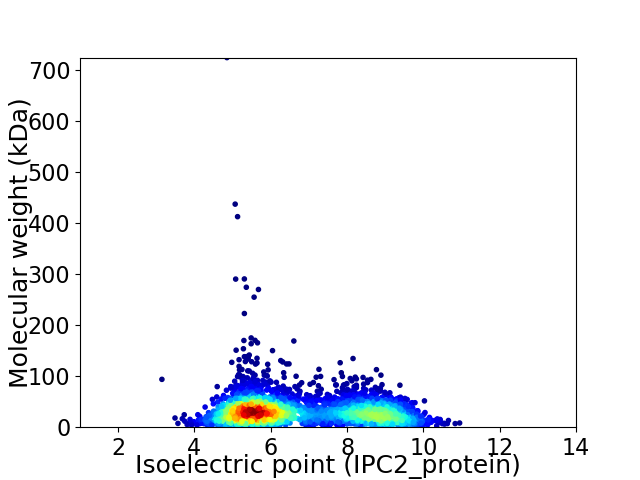
Virtual 2D-PAGE plot for 3602 proteins (isoelectric point calculated using IPC2_protein)
Get csv file with sequences according to given criteria:
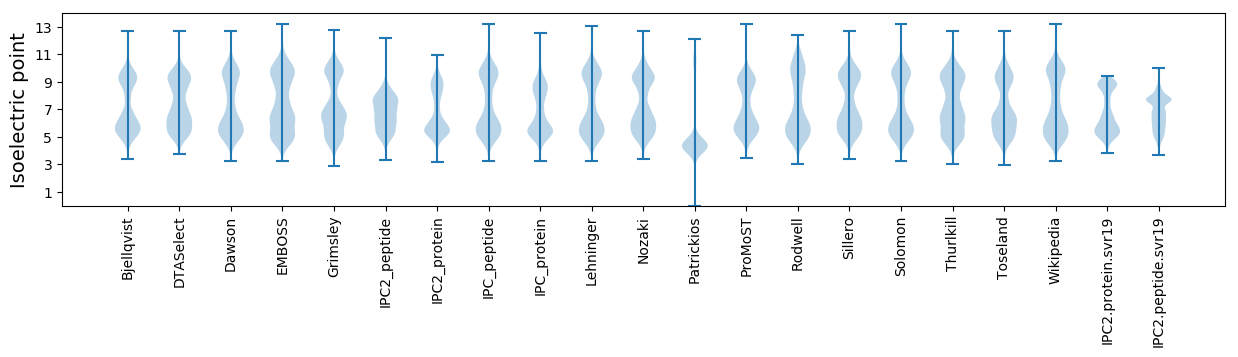
* You can choose from 21 different methods for calculating isoelectric point
Summary statistics related to proteome-wise predictions
Protein with the lowest isoelectric point:
>tr|A0A1I3T481|A0A1I3T481_9BACL Cupredoxin-like domain-containing protein OS=Thermoflavimicrobium dichotomicum OX=46223 GN=SAMN05421852_11517 PE=4 SV=1
MM1 pKa = 7.57EE2 pKa = 6.13GDD4 pKa = 4.23DD5 pKa = 4.8EE6 pKa = 4.74EE7 pKa = 6.68DD8 pKa = 3.5SGDD11 pKa = 3.72QEE13 pKa = 4.32VSSMISLAGTMMILTGVLEE32 pKa = 4.43NPVHH36 pKa = 6.85LFFFVHH42 pKa = 7.21FYY44 pKa = 11.54GLVV47 pKa = 3.04
MM1 pKa = 7.57EE2 pKa = 6.13GDD4 pKa = 4.23DD5 pKa = 4.8EE6 pKa = 4.74EE7 pKa = 6.68DD8 pKa = 3.5SGDD11 pKa = 3.72QEE13 pKa = 4.32VSSMISLAGTMMILTGVLEE32 pKa = 4.43NPVHH36 pKa = 6.85LFFFVHH42 pKa = 7.21FYY44 pKa = 11.54GLVV47 pKa = 3.04
Molecular weight: 5.21 kDa
Isoelectric point according different methods:
Protein with the highest isoelectric point:
>tr|A0A1I3N8F7|A0A1I3N8F7_9BACL Hydroxymethylglutaryl-CoA lyase OS=Thermoflavimicrobium dichotomicum OX=46223 GN=SAMN05421852_10423 PE=3 SV=1
MM1 pKa = 7.31NRR3 pKa = 11.84RR4 pKa = 11.84ISSVILILLSVVALVFPFIKK24 pKa = 9.07TRR26 pKa = 11.84RR27 pKa = 11.84MKK29 pKa = 10.48PLFRR33 pKa = 11.84RR34 pKa = 11.84SWSWIKK40 pKa = 10.54RR41 pKa = 11.84MKK43 pKa = 10.54LDD45 pKa = 3.3IVFGRR50 pKa = 11.84ALTNLWRR57 pKa = 11.84KK58 pKa = 10.22KK59 pKa = 9.31IMRR62 pKa = 11.84RR63 pKa = 11.84LRR65 pKa = 11.84LVV67 pKa = 3.02
MM1 pKa = 7.31NRR3 pKa = 11.84RR4 pKa = 11.84ISSVILILLSVVALVFPFIKK24 pKa = 9.07TRR26 pKa = 11.84RR27 pKa = 11.84MKK29 pKa = 10.48PLFRR33 pKa = 11.84RR34 pKa = 11.84SWSWIKK40 pKa = 10.54RR41 pKa = 11.84MKK43 pKa = 10.54LDD45 pKa = 3.3IVFGRR50 pKa = 11.84ALTNLWRR57 pKa = 11.84KK58 pKa = 10.22KK59 pKa = 9.31IMRR62 pKa = 11.84RR63 pKa = 11.84LRR65 pKa = 11.84LVV67 pKa = 3.02
Molecular weight: 8.23 kDa
Isoelectric point according different methods:
Peptides (in silico digests for buttom-up proteomics)
Below you can find in silico digests of the whole proteome with Trypsin, Chymotrypsin, Trypsin+LysC, LysN, ArgC proteases suitable for different mass spec machines.| Try ESI |
 |
|---|
| ChTry ESI |
|
|---|
| ArgC ESI |
|
|---|
| LysN ESI |
|
|---|
| TryLysC ESI |
|
|---|
| Try MALDI |
|
|---|
| ChTry MALDI |
|
|---|
| ArgC MALDI |
|
|---|
| LysN MALDI |
|
|---|
| TryLysC MALDI |
|
|---|
| Try LTQ |
|
|---|
| ChTry LTQ |
|
|---|
| ArgC LTQ |
|
|---|
| LysN LTQ |
|
|---|
| TryLysC LTQ |
|
|---|
| Try MSlow |
|
|---|
| ChTry MSlow |
|
|---|
| ArgC MSlow |
|
|---|
| LysN MSlow |
|
|---|
| TryLysC MSlow |
|
|---|
| Try MShigh |
|
|---|
| ChTry MShigh |
|
|---|
| ArgC MShigh |
|
|---|
| LysN MShigh |
|
|---|
| TryLysC MShigh |
|
|---|
General Statistics
Number of major isoforms |
Number of additional isoforms |
Number of all proteins |
Number of amino acids |
Min. Seq. Length |
Max. Seq. Length |
Avg. Seq. Length |
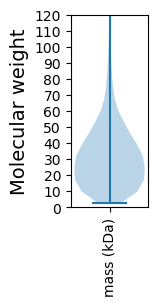
Avg. Mol. Weight |
|---|---|---|---|---|---|---|---|
0 |
1067728 |
24 |
6425 |
296.4 |
33.44 |
Amino acid frequency
Ala |
Cys |
Asp |
Glu |
Phe |
Gly |
His |
Ile |
Lys |
Leu |
|---|---|---|---|---|---|---|---|---|---|
7.19 ± 0.045 | 0.899 ± 0.012 |
4.781 ± 0.045 | 7.387 ± 0.053 |
4.164 ± 0.031 | 6.889 ± 0.039 |
2.416 ± 0.019 | 7.329 ± 0.045 |
6.495 ± 0.049 | 10.098 ± 0.04 |
Met |
Asn |
Gln |
Pro |
Arg |
Ser |
Thr |
Val |
Trp |
Tyr |
|---|---|---|---|---|---|---|---|---|---|
2.695 ± 0.02 | 3.41 ± 0.026 |
4.28 ± 0.028 | 4.521 ± 0.032 |
5.104 ± 0.031 | 5.495 ± 0.032 |
4.963 ± 0.026 | 7.161 ± 0.035 |
1.316 ± 0.017 | 3.407 ± 0.024 |
Most of the basic statistics you can see at this page can be downloaded from this CSV file
See this proteome in:

Proteome-pI is available under Creative Commons Attribution-NoDerivs license, for more details see here
| Reference: Kozlowski LP. Proteome-pI 2.0: Proteome Isoelectric Point Database Update. Nucleic Acids Res. 2021, doi: 10.1093/nar/gkab944 | Contact: Lukasz P. Kozlowski |