Brevundimonas sp. SH203
Taxonomy: cellular organisms; Bacteria; Proteobacteria; Alphaproteobacteria; Caulobacterales; Caulobacteraceae; Brevundimonas; unclassified Brevundimonas
Average proteome isoelectric point is 6.48
Get precalculated fractions of proteins
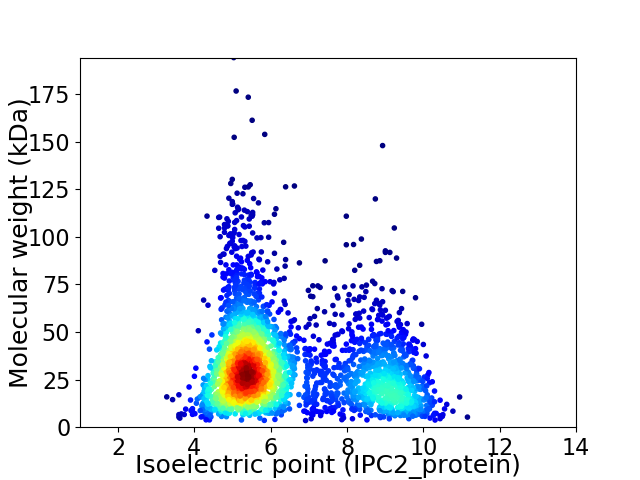
Virtual 2D-PAGE plot for 2958 proteins (isoelectric point calculated using IPC2_protein)
Get csv file with sequences according to given criteria:
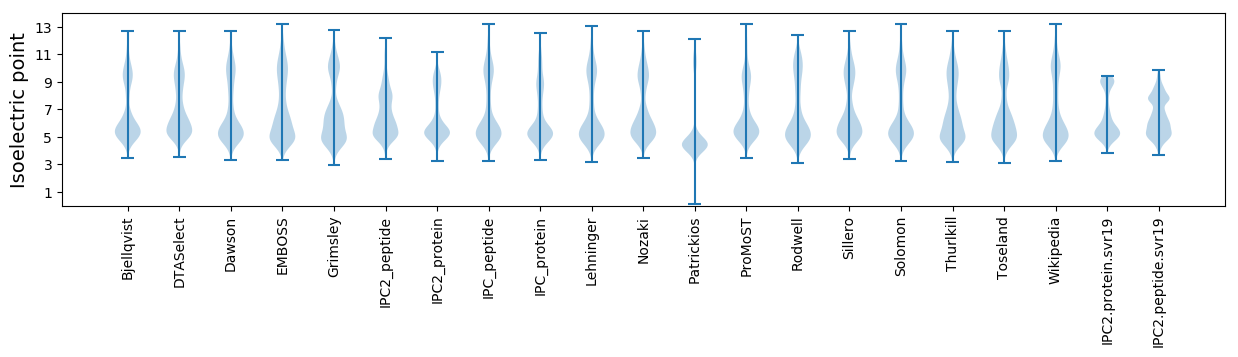
* You can choose from 21 different methods for calculating isoelectric point
Summary statistics related to proteome-wise predictions
Protein with the lowest isoelectric point:
>tr|A0A1V1V094|A0A1V1V094_9CAUL Uncharacterized protein OS=Brevundimonas sp. SH203 OX=345167 GN=SH203_01961 PE=4 SV=1
MM1 pKa = 7.19TADD4 pKa = 3.38DD5 pKa = 4.71TIYY8 pKa = 10.43QAEE11 pKa = 5.08GYY13 pKa = 9.32MDD15 pKa = 6.31DD16 pKa = 5.17DD17 pKa = 3.79LHH19 pKa = 6.63EE20 pKa = 5.7ADD22 pKa = 3.01IVEE25 pKa = 4.49WYY27 pKa = 7.65EE28 pKa = 3.72ARR30 pKa = 11.84PVTVSTAVAAGAVVTAFTLGALAAVGALFLIGRR63 pKa = 11.84LDD65 pKa = 3.59DD66 pKa = 3.75
MM1 pKa = 7.19TADD4 pKa = 3.38DD5 pKa = 4.71TIYY8 pKa = 10.43QAEE11 pKa = 5.08GYY13 pKa = 9.32MDD15 pKa = 6.31DD16 pKa = 5.17DD17 pKa = 3.79LHH19 pKa = 6.63EE20 pKa = 5.7ADD22 pKa = 3.01IVEE25 pKa = 4.49WYY27 pKa = 7.65EE28 pKa = 3.72ARR30 pKa = 11.84PVTVSTAVAAGAVVTAFTLGALAAVGALFLIGRR63 pKa = 11.84LDD65 pKa = 3.59DD66 pKa = 3.75
Molecular weight: 6.98 kDa
Isoelectric point according different methods:
Protein with the highest isoelectric point:
>tr|A0A1V1V124|A0A1V1V124_9CAUL Competence protein ComM OS=Brevundimonas sp. SH203 OX=345167 GN=comM PE=3 SV=1
MM1 pKa = 7.35KK2 pKa = 9.4RR3 pKa = 11.84TYY5 pKa = 10.2QPSRR9 pKa = 11.84LVRR12 pKa = 11.84KK13 pKa = 8.99RR14 pKa = 11.84RR15 pKa = 11.84HH16 pKa = 4.7GFRR19 pKa = 11.84SRR21 pKa = 11.84MATKK25 pKa = 10.2NGQKK29 pKa = 9.53IVARR33 pKa = 11.84RR34 pKa = 11.84RR35 pKa = 11.84AKK37 pKa = 9.77GRR39 pKa = 11.84KK40 pKa = 9.04RR41 pKa = 11.84LTAA44 pKa = 4.18
MM1 pKa = 7.35KK2 pKa = 9.4RR3 pKa = 11.84TYY5 pKa = 10.2QPSRR9 pKa = 11.84LVRR12 pKa = 11.84KK13 pKa = 8.99RR14 pKa = 11.84RR15 pKa = 11.84HH16 pKa = 4.7GFRR19 pKa = 11.84SRR21 pKa = 11.84MATKK25 pKa = 10.2NGQKK29 pKa = 9.53IVARR33 pKa = 11.84RR34 pKa = 11.84RR35 pKa = 11.84AKK37 pKa = 9.77GRR39 pKa = 11.84KK40 pKa = 9.04RR41 pKa = 11.84LTAA44 pKa = 4.18
Molecular weight: 5.31 kDa
Isoelectric point according different methods:
Peptides (in silico digests for buttom-up proteomics)
Below you can find in silico digests of the whole proteome with Trypsin, Chymotrypsin, Trypsin+LysC, LysN, ArgC proteases suitable for different mass spec machines.| Try ESI |
 |
|---|
| ChTry ESI |
|
|---|
| ArgC ESI |
|
|---|
| LysN ESI |
|
|---|
| TryLysC ESI |
|
|---|
| Try MALDI |
|
|---|
| ChTry MALDI |
|
|---|
| ArgC MALDI |
|
|---|
| LysN MALDI |
|
|---|
| TryLysC MALDI |
|
|---|
| Try LTQ |
|
|---|
| ChTry LTQ |
|
|---|
| ArgC LTQ |
|
|---|
| LysN LTQ |
|
|---|
| TryLysC LTQ |
|
|---|
| Try MSlow |
|
|---|
| ChTry MSlow |
|
|---|
| ArgC MSlow |
|
|---|
| LysN MSlow |
|
|---|
| TryLysC MSlow |
|
|---|
| Try MShigh |
|
|---|
| ChTry MShigh |
|
|---|
| ArgC MShigh |
|
|---|
| LysN MShigh |
|
|---|
| TryLysC MShigh |
|
|---|
General Statistics
Number of major isoforms |
Number of additional isoforms |
Number of all proteins |
Number of amino acids |
Min. Seq. Length |
Max. Seq. Length |
Avg. Seq. Length |
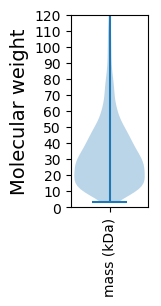
Avg. Mol. Weight |
|---|---|---|---|---|---|---|---|
0 |
942333 |
30 |
1827 |
318.6 |
34.3 |
Amino acid frequency
Ala |
Cys |
Asp |
Glu |
Phe |
Gly |
His |
Ile |
Lys |
Leu |
|---|---|---|---|---|---|---|---|---|---|
13.879 ± 0.074 | 0.682 ± 0.012 |
6.169 ± 0.035 | 5.313 ± 0.046 |
3.477 ± 0.028 | 8.981 ± 0.04 |
1.756 ± 0.021 | 4.391 ± 0.027 |
2.858 ± 0.036 | 9.813 ± 0.054 |
Met |
Asn |
Gln |
Pro |
Arg |
Ser |
Thr |
Val |
Trp |
Tyr |
|---|---|---|---|---|---|---|---|---|---|
2.306 ± 0.022 | 2.429 ± 0.034 |
5.417 ± 0.035 | 3.28 ± 0.025 |
7.544 ± 0.049 | 5.004 ± 0.032 |
5.397 ± 0.037 | 7.708 ± 0.039 |
1.475 ± 0.02 | 2.12 ± 0.025 |
Most of the basic statistics you can see at this page can be downloaded from this CSV file
See this proteome in:

Proteome-pI is available under Creative Commons Attribution-NoDerivs license, for more details see here
| Reference: Kozlowski LP. Proteome-pI 2.0: Proteome Isoelectric Point Database Update. Nucleic Acids Res. 2021, doi: 10.1093/nar/gkab944 | Contact: Lukasz P. Kozlowski |