Bacillus phage Wip1
Taxonomy: Viruses; Varidnaviria; Bamfordvirae; Preplasmiviricota; Tectiliviricetes; Kalamavirales; Tectiviridae; Betatectivirus; Bacillus virus Wip1
Average proteome isoelectric point is 6.93
Get precalculated fractions of proteins
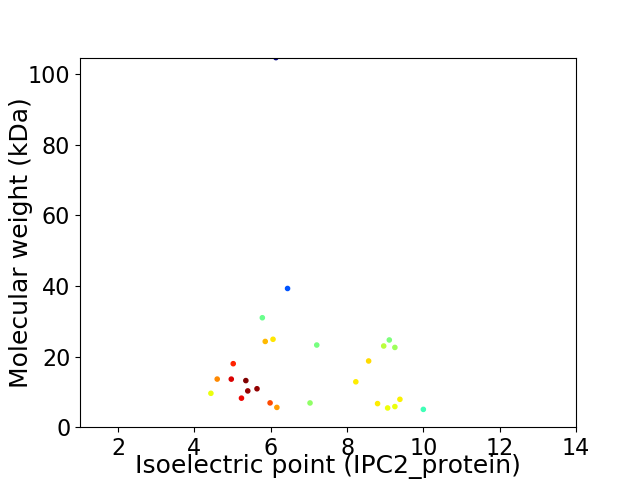
Virtual 2D-PAGE plot for 27 proteins (isoelectric point calculated using IPC2_protein)
Get csv file with sequences according to given criteria:
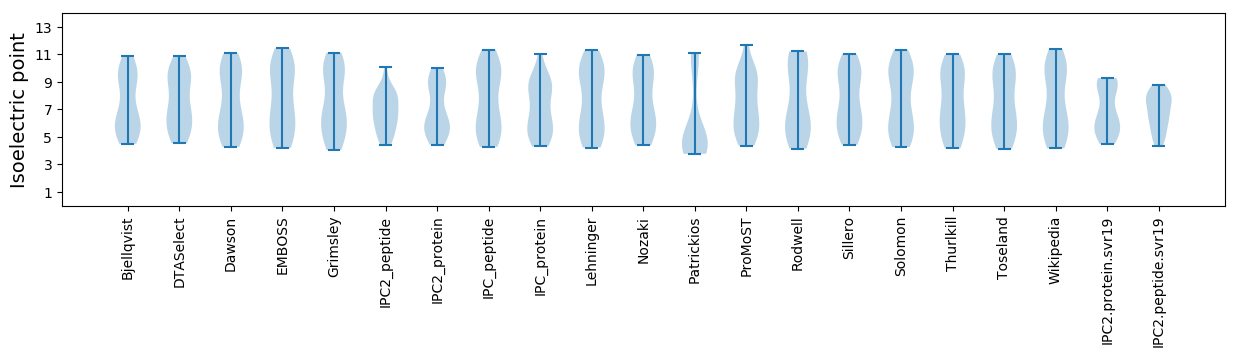
* You can choose from 21 different methods for calculating isoelectric point
Summary statistics related to proteome-wise predictions
Protein with the lowest isoelectric point:
>tr|S5Y6J0|S5Y6J0_9VIRU Uncharacterized protein OS=Bacillus phage Wip1 OX=663237 PE=4 SV=1
MM1 pKa = 7.94LDD3 pKa = 3.39QIKK6 pKa = 10.18VPNEE10 pKa = 3.8NKK12 pKa = 10.06GSKK15 pKa = 7.64QEE17 pKa = 3.94RR18 pKa = 11.84LQLVVDD24 pKa = 3.79QVVDD28 pKa = 3.74SLPTTVRR35 pKa = 11.84LLAGSYY41 pKa = 10.45LNSFRR46 pKa = 11.84QVLEE50 pKa = 4.45SEE52 pKa = 4.36QQDD55 pKa = 2.74IDD57 pKa = 4.26GNIDD61 pKa = 3.3NALSRR66 pKa = 11.84LRR68 pKa = 11.84EE69 pKa = 4.13YY70 pKa = 10.41IDD72 pKa = 3.81YY73 pKa = 10.24IQYY76 pKa = 10.89GHH78 pKa = 6.39DD79 pKa = 3.6QEE81 pKa = 5.88NEE83 pKa = 3.7
MM1 pKa = 7.94LDD3 pKa = 3.39QIKK6 pKa = 10.18VPNEE10 pKa = 3.8NKK12 pKa = 10.06GSKK15 pKa = 7.64QEE17 pKa = 3.94RR18 pKa = 11.84LQLVVDD24 pKa = 3.79QVVDD28 pKa = 3.74SLPTTVRR35 pKa = 11.84LLAGSYY41 pKa = 10.45LNSFRR46 pKa = 11.84QVLEE50 pKa = 4.45SEE52 pKa = 4.36QQDD55 pKa = 2.74IDD57 pKa = 4.26GNIDD61 pKa = 3.3NALSRR66 pKa = 11.84LRR68 pKa = 11.84EE69 pKa = 4.13YY70 pKa = 10.41IDD72 pKa = 3.81YY73 pKa = 10.24IQYY76 pKa = 10.89GHH78 pKa = 6.39DD79 pKa = 3.6QEE81 pKa = 5.88NEE83 pKa = 3.7
Molecular weight: 9.59 kDa
Isoelectric point according different methods:
Protein with the highest isoelectric point:
>tr|S5Z7E7|S5Z7E7_9VIRU Putative trimeric spike protein OS=Bacillus phage Wip1 OX=663237 PE=4 SV=1
MM1 pKa = 7.23GRR3 pKa = 11.84ILGIISGIGLLIALYY18 pKa = 10.59LFLSNARR25 pKa = 11.84QTTQIIDD32 pKa = 3.65SMAGNAVSGIKK43 pKa = 9.92VLQGRR48 pKa = 4.11
MM1 pKa = 7.23GRR3 pKa = 11.84ILGIISGIGLLIALYY18 pKa = 10.59LFLSNARR25 pKa = 11.84QTTQIIDD32 pKa = 3.65SMAGNAVSGIKK43 pKa = 9.92VLQGRR48 pKa = 4.11
Molecular weight: 5.05 kDa
Isoelectric point according different methods:
Peptides (in silico digests for buttom-up proteomics)
Below you can find in silico digests of the whole proteome with Trypsin, Chymotrypsin, Trypsin+LysC, LysN, ArgC proteases suitable for different mass spec machines.| Try ESI |
 |
|---|
| ChTry ESI |
|
|---|
| ArgC ESI |
|
|---|
| LysN ESI |
|
|---|
| TryLysC ESI |
|
|---|
| Try MALDI |
|
|---|
| ChTry MALDI |
|
|---|
| ArgC MALDI |
|
|---|
| LysN MALDI |
|
|---|
| TryLysC MALDI |
|
|---|
| Try LTQ |
|
|---|
| ChTry LTQ |
|
|---|
| ArgC LTQ |
|
|---|
| LysN LTQ |
|
|---|
| TryLysC LTQ |
|
|---|
| Try MSlow |
|
|---|
| ChTry MSlow |
|
|---|
| ArgC MSlow |
|
|---|
| LysN MSlow |
|
|---|
| TryLysC MSlow |
|
|---|
| Try MShigh |
|
|---|
| ChTry MShigh |
|
|---|
| ArgC MShigh |
|
|---|
| LysN MShigh |
|
|---|
| TryLysC MShigh |
|
|---|
General Statistics
Number of major isoforms |
Number of additional isoforms |
Number of all proteins |
Number of amino acids |
Min. Seq. Length |
Max. Seq. Length |
Avg. Seq. Length |
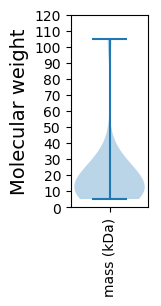
Avg. Mol. Weight |
|---|---|---|---|---|---|---|---|
0 |
4405 |
47 |
898 |
163.1 |
18.4 |
Amino acid frequency
Ala |
Cys |
Asp |
Glu |
Phe |
Gly |
His |
Ile |
Lys |
Leu |
|---|---|---|---|---|---|---|---|---|---|
5.607 ± 0.676 | 0.613 ± 0.218 |
5.766 ± 0.484 | 7.151 ± 0.813 |
4.858 ± 0.436 | 7.242 ± 0.778 |
1.362 ± 0.211 | 6.652 ± 0.691 |
8.876 ± 0.768 | 7.9 ± 0.492 |
Met |
Asn |
Gln |
Pro |
Arg |
Ser |
Thr |
Val |
Trp |
Tyr |
|---|---|---|---|---|---|---|---|---|---|
2.951 ± 0.331 | 5.789 ± 0.53 |
3.814 ± 0.354 | 3.768 ± 0.461 |
4.336 ± 0.407 | 6.22 ± 0.421 |
5.766 ± 0.626 | 6.674 ± 0.624 |
1.112 ± 0.257 | 3.36 ± 0.386 |
Most of the basic statistics you can see at this page can be downloaded from this CSV file
See this proteome in:

Proteome-pI is available under Creative Commons Attribution-NoDerivs license, for more details see here
| Reference: Kozlowski LP. Proteome-pI 2.0: Proteome Isoelectric Point Database Update. Nucleic Acids Res. 2021, doi: 10.1093/nar/gkab944 | Contact: Lukasz P. Kozlowski |