Skermania phage SPI1
Taxonomy: Viruses; Duplodnaviria; Heunggongvirae; Uroviricota; Caudoviricetes; Caudovirales; Siphoviridae; unclassified Siphoviridae
Average proteome isoelectric point is 6.1
Get precalculated fractions of proteins
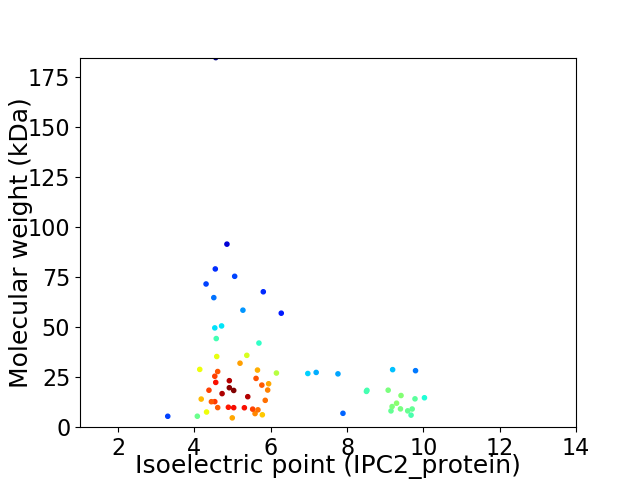
Virtual 2D-PAGE plot for 67 proteins (isoelectric point calculated using IPC2_protein)
Get csv file with sequences according to given criteria:
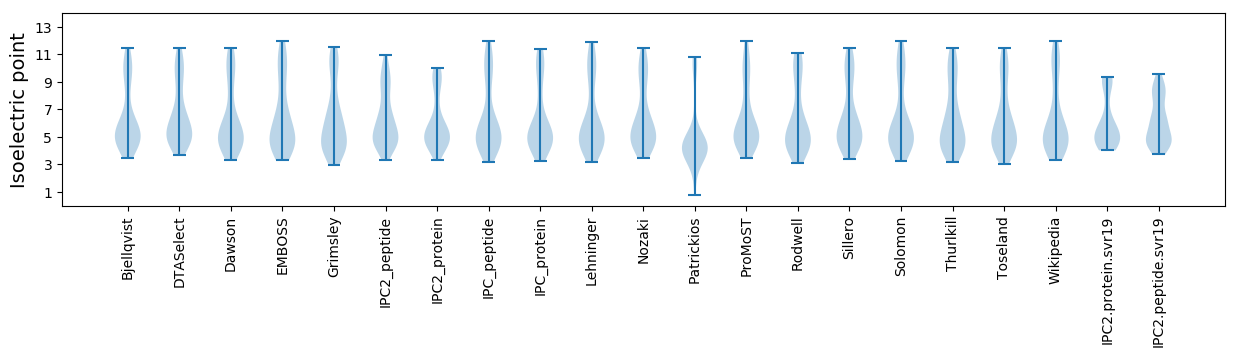
* You can choose from 21 different methods for calculating isoelectric point
Summary statistics related to proteome-wise predictions
Protein with the lowest isoelectric point:
>tr|A0A0N7C8T0|A0A0N7C8T0_9CAUD Uncharacterized protein OS=Skermania phage SPI1 OX=1636544 GN=SPI1_46 PE=4 SV=1
MM1 pKa = 7.7AIDD4 pKa = 3.77PLIYY8 pKa = 9.62EE9 pKa = 5.03APPLPTQGYY18 pKa = 8.6GLYY21 pKa = 10.43AAARR25 pKa = 11.84LIDD28 pKa = 3.66TGDD31 pKa = 3.35TSRR34 pKa = 11.84EE35 pKa = 3.93LLAGTDD41 pKa = 3.26IHH43 pKa = 7.5SVNCDD48 pKa = 3.73LGSGTYY54 pKa = 8.8GTDD57 pKa = 3.16LCEE60 pKa = 4.01TPPAVKK66 pKa = 9.74TPGTPARR73 pKa = 4.19
MM1 pKa = 7.7AIDD4 pKa = 3.77PLIYY8 pKa = 9.62EE9 pKa = 5.03APPLPTQGYY18 pKa = 8.6GLYY21 pKa = 10.43AAARR25 pKa = 11.84LIDD28 pKa = 3.66TGDD31 pKa = 3.35TSRR34 pKa = 11.84EE35 pKa = 3.93LLAGTDD41 pKa = 3.26IHH43 pKa = 7.5SVNCDD48 pKa = 3.73LGSGTYY54 pKa = 8.8GTDD57 pKa = 3.16LCEE60 pKa = 4.01TPPAVKK66 pKa = 9.74TPGTPARR73 pKa = 4.19
Molecular weight: 7.59 kDa
Isoelectric point according different methods:
Protein with the highest isoelectric point:
>tr|A0A0N7C8R5|A0A0N7C8R5_9CAUD Uncharacterized protein OS=Skermania phage SPI1 OX=1636544 GN=SPI1_56 PE=4 SV=1
MM1 pKa = 7.43NIDD4 pKa = 3.46GYY6 pKa = 7.48MTRR9 pKa = 11.84TDD11 pKa = 3.02VAKK14 pKa = 10.47FVGVKK19 pKa = 9.56PDD21 pKa = 3.21SLSRR25 pKa = 11.84SNLPPPNLVVGRR37 pKa = 11.84SRR39 pKa = 11.84LWTRR43 pKa = 11.84EE44 pKa = 3.9VIEE47 pKa = 4.08EE48 pKa = 3.96WAAARR53 pKa = 11.84PGIGGRR59 pKa = 11.84WPDD62 pKa = 3.66PDD64 pKa = 2.86GTRR67 pKa = 11.84YY68 pKa = 9.69KK69 pKa = 10.69RR70 pKa = 11.84RR71 pKa = 11.84TT72 pKa = 3.39
MM1 pKa = 7.43NIDD4 pKa = 3.46GYY6 pKa = 7.48MTRR9 pKa = 11.84TDD11 pKa = 3.02VAKK14 pKa = 10.47FVGVKK19 pKa = 9.56PDD21 pKa = 3.21SLSRR25 pKa = 11.84SNLPPPNLVVGRR37 pKa = 11.84SRR39 pKa = 11.84LWTRR43 pKa = 11.84EE44 pKa = 3.9VIEE47 pKa = 4.08EE48 pKa = 3.96WAAARR53 pKa = 11.84PGIGGRR59 pKa = 11.84WPDD62 pKa = 3.66PDD64 pKa = 2.86GTRR67 pKa = 11.84YY68 pKa = 9.69KK69 pKa = 10.69RR70 pKa = 11.84RR71 pKa = 11.84TT72 pKa = 3.39
Molecular weight: 8.17 kDa
Isoelectric point according different methods:
Peptides (in silico digests for buttom-up proteomics)
Below you can find in silico digests of the whole proteome with Trypsin, Chymotrypsin, Trypsin+LysC, LysN, ArgC proteases suitable for different mass spec machines.| Try ESI |
 |
|---|
| ChTry ESI |
|
|---|
| ArgC ESI |
|
|---|
| LysN ESI |
|
|---|
| TryLysC ESI |
|
|---|
| Try MALDI |
|
|---|
| ChTry MALDI |
|
|---|
| ArgC MALDI |
|
|---|
| LysN MALDI |
|
|---|
| TryLysC MALDI |
|
|---|
| Try LTQ |
|
|---|
| ChTry LTQ |
|
|---|
| ArgC LTQ |
|
|---|
| LysN LTQ |
|
|---|
| TryLysC LTQ |
|
|---|
| Try MSlow |
|
|---|
| ChTry MSlow |
|
|---|
| ArgC MSlow |
|
|---|
| LysN MSlow |
|
|---|
| TryLysC MSlow |
|
|---|
| Try MShigh |
|
|---|
| ChTry MShigh |
|
|---|
| ArgC MShigh |
|
|---|
| LysN MShigh |
|
|---|
| TryLysC MShigh |
|
|---|
General Statistics
Number of major isoforms |
Number of additional isoforms |
Number of all proteins |
Number of amino acids |
Min. Seq. Length |
Max. Seq. Length |
Avg. Seq. Length |
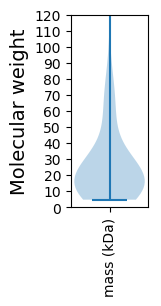
Avg. Mol. Weight |
|---|---|---|---|---|---|---|---|
0 |
17200 |
42 |
1800 |
256.7 |
27.64 |
Amino acid frequency
Ala |
Cys |
Asp |
Glu |
Phe |
Gly |
His |
Ile |
Lys |
Leu |
|---|---|---|---|---|---|---|---|---|---|
13.07 ± 0.454 | 0.919 ± 0.146 |
7.599 ± 0.255 | 5.006 ± 0.217 |
1.843 ± 0.179 | 8.483 ± 0.258 |
1.762 ± 0.194 | 4.262 ± 0.229 |
1.651 ± 0.208 | 8.698 ± 0.296 |
Met |
Asn |
Gln |
Pro |
Arg |
Ser |
Thr |
Val |
Trp |
Tyr |
|---|---|---|---|---|---|---|---|---|---|
1.913 ± 0.101 | 1.494 ± 0.146 |
6.25 ± 0.253 | 2.523 ± 0.255 |
8.238 ± 0.505 | 5.913 ± 0.222 |
7.395 ± 0.333 | 8.302 ± 0.255 |
2.198 ± 0.197 | 2.483 ± 0.216 |
Most of the basic statistics you can see at this page can be downloaded from this CSV file
See this proteome in:

Proteome-pI is available under Creative Commons Attribution-NoDerivs license, for more details see here
| Reference: Kozlowski LP. Proteome-pI 2.0: Proteome Isoelectric Point Database Update. Nucleic Acids Res. 2021, doi: 10.1093/nar/gkab944 | Contact: Lukasz P. Kozlowski |