Frondihabitans sp. PAMC 28766
Taxonomy: cellular organisms; Bacteria; Terrabacteria group; Actinobacteria; Actinomycetia; Micrococcales; Microbacteriaceae; Frondihabitans; unclassified Frondihabitans
Average proteome isoelectric point is 6.17
Get precalculated fractions of proteins
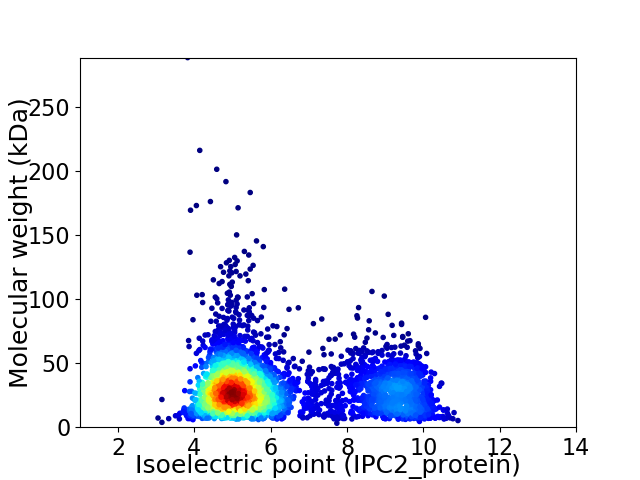
Virtual 2D-PAGE plot for 4103 proteins (isoelectric point calculated using IPC2_protein)
Get csv file with sequences according to given criteria:
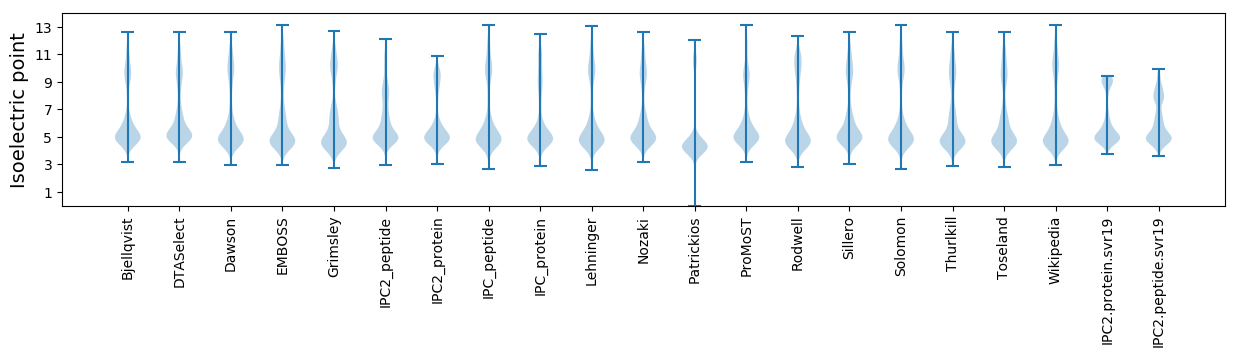
* You can choose from 21 different methods for calculating isoelectric point
Summary statistics related to proteome-wise predictions
Protein with the lowest isoelectric point:
>tr|A0A126YWF7|A0A126YWF7_9MICO D-inositol 3-phosphate glycosyltransferase OS=Frondihabitans sp. PAMC 28766 OX=1795630 GN=AX769_02265 PE=4 SV=1
MM1 pKa = 7.5APAVTAQAAEE11 pKa = 4.04ATSYY15 pKa = 9.62GTFALAGGARR25 pKa = 11.84AYY27 pKa = 9.26TGTMLLPGGFPATTFTSTSRR47 pKa = 11.84QVTVISGASTWQAASTPVGAVYY69 pKa = 10.34GSSKK73 pKa = 10.24GMPYY77 pKa = 10.72LNQRR81 pKa = 11.84PMADD85 pKa = 3.25NAASPAVTTYY95 pKa = 11.26SFATPSPASGWSFVLGDD112 pKa = 4.09IDD114 pKa = 5.36ADD116 pKa = 3.73QATVSATDD124 pKa = 3.49ANGAAVPIADD134 pKa = 4.59LGFQGVYY141 pKa = 10.1NYY143 pKa = 10.04CHH145 pKa = 5.01QTGGPSCDD153 pKa = 3.39SANVGDD159 pKa = 4.26VPTWDD164 pKa = 4.05PATGTLIGNTQASDD178 pKa = 3.62TEE180 pKa = 4.74GASGWFSPSVPLKK193 pKa = 9.78TLTITYY199 pKa = 6.84QQRR202 pKa = 11.84SGLPVYY208 pKa = 7.23QTWFATKK215 pKa = 8.87TYY217 pKa = 9.62AASGVVTVDD226 pKa = 3.22GKK228 pKa = 10.13PYY230 pKa = 10.65GGAKK234 pKa = 10.19VSITDD239 pKa = 3.35ASGATVATVTAGGDD253 pKa = 4.06GTWSVPGLVAAAGYY267 pKa = 9.02HH268 pKa = 5.1VAVATPPGAQDD279 pKa = 3.38ATPLAFDD286 pKa = 3.91TTAADD291 pKa = 3.56ATALDD296 pKa = 3.99VDD298 pKa = 4.76FTIPPVTVTGTITDD312 pKa = 3.45SGGQPAADD320 pKa = 3.83EE321 pKa = 5.2PIVITRR327 pKa = 11.84DD328 pKa = 3.15GDD330 pKa = 3.58DD331 pKa = 3.83APAVTTTTDD340 pKa = 2.93SAGGFTADD348 pKa = 4.86LLPSQDD354 pKa = 3.1YY355 pKa = 11.29SLVVDD360 pKa = 4.91GATDD364 pKa = 3.25QAIAFTTPTTSGALAPLAQPAAPVTTPPVTPPVTPPVTSTPPATGTAPAAAGDD417 pKa = 4.15AGDD420 pKa = 3.8EE421 pKa = 4.01LAYY424 pKa = 9.91TGSQPAWPALAGGALVLGGLVITLGSARR452 pKa = 11.84RR453 pKa = 11.84RR454 pKa = 11.84RR455 pKa = 11.84SPAEE459 pKa = 3.63RR460 pKa = 4.22
MM1 pKa = 7.5APAVTAQAAEE11 pKa = 4.04ATSYY15 pKa = 9.62GTFALAGGARR25 pKa = 11.84AYY27 pKa = 9.26TGTMLLPGGFPATTFTSTSRR47 pKa = 11.84QVTVISGASTWQAASTPVGAVYY69 pKa = 10.34GSSKK73 pKa = 10.24GMPYY77 pKa = 10.72LNQRR81 pKa = 11.84PMADD85 pKa = 3.25NAASPAVTTYY95 pKa = 11.26SFATPSPASGWSFVLGDD112 pKa = 4.09IDD114 pKa = 5.36ADD116 pKa = 3.73QATVSATDD124 pKa = 3.49ANGAAVPIADD134 pKa = 4.59LGFQGVYY141 pKa = 10.1NYY143 pKa = 10.04CHH145 pKa = 5.01QTGGPSCDD153 pKa = 3.39SANVGDD159 pKa = 4.26VPTWDD164 pKa = 4.05PATGTLIGNTQASDD178 pKa = 3.62TEE180 pKa = 4.74GASGWFSPSVPLKK193 pKa = 9.78TLTITYY199 pKa = 6.84QQRR202 pKa = 11.84SGLPVYY208 pKa = 7.23QTWFATKK215 pKa = 8.87TYY217 pKa = 9.62AASGVVTVDD226 pKa = 3.22GKK228 pKa = 10.13PYY230 pKa = 10.65GGAKK234 pKa = 10.19VSITDD239 pKa = 3.35ASGATVATVTAGGDD253 pKa = 4.06GTWSVPGLVAAAGYY267 pKa = 9.02HH268 pKa = 5.1VAVATPPGAQDD279 pKa = 3.38ATPLAFDD286 pKa = 3.91TTAADD291 pKa = 3.56ATALDD296 pKa = 3.99VDD298 pKa = 4.76FTIPPVTVTGTITDD312 pKa = 3.45SGGQPAADD320 pKa = 3.83EE321 pKa = 5.2PIVITRR327 pKa = 11.84DD328 pKa = 3.15GDD330 pKa = 3.58DD331 pKa = 3.83APAVTTTTDD340 pKa = 2.93SAGGFTADD348 pKa = 4.86LLPSQDD354 pKa = 3.1YY355 pKa = 11.29SLVVDD360 pKa = 4.91GATDD364 pKa = 3.25QAIAFTTPTTSGALAPLAQPAAPVTTPPVTPPVTPPVTSTPPATGTAPAAAGDD417 pKa = 4.15AGDD420 pKa = 3.8EE421 pKa = 4.01LAYY424 pKa = 9.91TGSQPAWPALAGGALVLGGLVITLGSARR452 pKa = 11.84RR453 pKa = 11.84RR454 pKa = 11.84RR455 pKa = 11.84SPAEE459 pKa = 3.63RR460 pKa = 4.22
Molecular weight: 45.62 kDa
Isoelectric point according different methods:
Protein with the highest isoelectric point:
>tr|A0A126YWX1|A0A126YWX1_9MICO Cell division protein CrgA OS=Frondihabitans sp. PAMC 28766 OX=1795630 GN=crgA PE=3 SV=1
MM1 pKa = 7.69SKK3 pKa = 9.0RR4 pKa = 11.84TFQPNNRR11 pKa = 11.84RR12 pKa = 11.84KK13 pKa = 9.59AKK15 pKa = 9.91KK16 pKa = 8.54HH17 pKa = 4.37GFRR20 pKa = 11.84ARR22 pKa = 11.84MRR24 pKa = 11.84TRR26 pKa = 11.84AGRR29 pKa = 11.84AILAARR35 pKa = 11.84RR36 pKa = 11.84GKK38 pKa = 10.68GRR40 pKa = 11.84TEE42 pKa = 4.13LSAA45 pKa = 4.86
MM1 pKa = 7.69SKK3 pKa = 9.0RR4 pKa = 11.84TFQPNNRR11 pKa = 11.84RR12 pKa = 11.84KK13 pKa = 9.59AKK15 pKa = 9.91KK16 pKa = 8.54HH17 pKa = 4.37GFRR20 pKa = 11.84ARR22 pKa = 11.84MRR24 pKa = 11.84TRR26 pKa = 11.84AGRR29 pKa = 11.84AILAARR35 pKa = 11.84RR36 pKa = 11.84GKK38 pKa = 10.68GRR40 pKa = 11.84TEE42 pKa = 4.13LSAA45 pKa = 4.86
Molecular weight: 5.2 kDa
Isoelectric point according different methods:
Peptides (in silico digests for buttom-up proteomics)
Below you can find in silico digests of the whole proteome with Trypsin, Chymotrypsin, Trypsin+LysC, LysN, ArgC proteases suitable for different mass spec machines.| Try ESI |
 |
|---|
| ChTry ESI |
|
|---|
| ArgC ESI |
|
|---|
| LysN ESI |
|
|---|
| TryLysC ESI |
|
|---|
| Try MALDI |
|
|---|
| ChTry MALDI |
|
|---|
| ArgC MALDI |
|
|---|
| LysN MALDI |
|
|---|
| TryLysC MALDI |
|
|---|
| Try LTQ |
|
|---|
| ChTry LTQ |
|
|---|
| ArgC LTQ |
|
|---|
| LysN LTQ |
|
|---|
| TryLysC LTQ |
|
|---|
| Try MSlow |
|
|---|
| ChTry MSlow |
|
|---|
| ArgC MSlow |
|
|---|
| LysN MSlow |
|
|---|
| TryLysC MSlow |
|
|---|
| Try MShigh |
|
|---|
| ChTry MShigh |
|
|---|
| ArgC MShigh |
|
|---|
| LysN MShigh |
|
|---|
| TryLysC MShigh |
|
|---|
General Statistics
Number of major isoforms |
Number of additional isoforms |
Number of all proteins |
Number of amino acids |
Min. Seq. Length |
Max. Seq. Length |
Avg. Seq. Length |
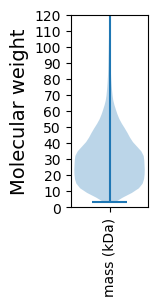
Avg. Mol. Weight |
|---|---|---|---|---|---|---|---|
0 |
1237931 |
28 |
3005 |
301.7 |
32.17 |
Amino acid frequency
Ala |
Cys |
Asp |
Glu |
Phe |
Gly |
His |
Ile |
Lys |
Leu |
|---|---|---|---|---|---|---|---|---|---|
13.047 ± 0.048 | 0.492 ± 0.009 |
6.162 ± 0.039 | 5.008 ± 0.044 |
3.223 ± 0.024 | 8.96 ± 0.036 |
2.039 ± 0.019 | 4.499 ± 0.029 |
2.253 ± 0.03 | 9.874 ± 0.045 |
Met |
Asn |
Gln |
Pro |
Arg |
Ser |
Thr |
Val |
Trp |
Tyr |
|---|---|---|---|---|---|---|---|---|---|
1.705 ± 0.016 | 2.092 ± 0.02 |
5.314 ± 0.028 | 2.884 ± 0.022 |
6.792 ± 0.048 | 6.507 ± 0.04 |
6.75 ± 0.058 | 8.949 ± 0.043 |
1.432 ± 0.016 | 2.02 ± 0.019 |
Most of the basic statistics you can see at this page can be downloaded from this CSV file
See this proteome in:

Proteome-pI is available under Creative Commons Attribution-NoDerivs license, for more details see here
| Reference: Kozlowski LP. Proteome-pI 2.0: Proteome Isoelectric Point Database Update. Nucleic Acids Res. 2021, doi: 10.1093/nar/gkab944 | Contact: Lukasz P. Kozlowski |