Rhodobacter sp. LPB0142
Taxonomy: cellular organisms; Bacteria; Proteobacteria; Alphaproteobacteria; Rhodobacterales; Rhodobacteraceae; Rhodobacter; unclassified Rhodobacter
Average proteome isoelectric point is 6.46
Get precalculated fractions of proteins
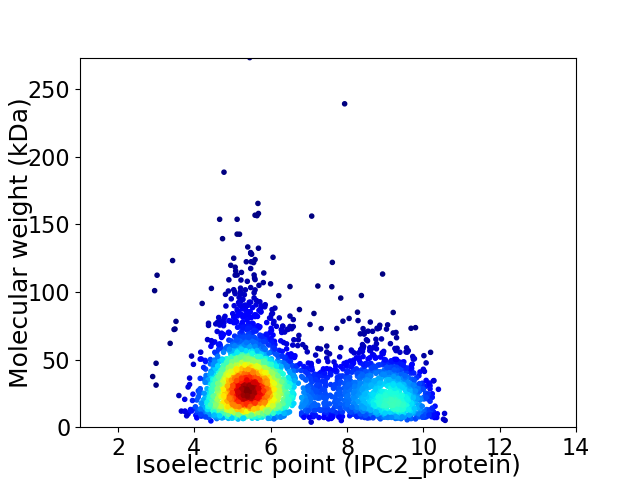
Virtual 2D-PAGE plot for 3414 proteins (isoelectric point calculated using IPC2_protein)
Get csv file with sequences according to given criteria:
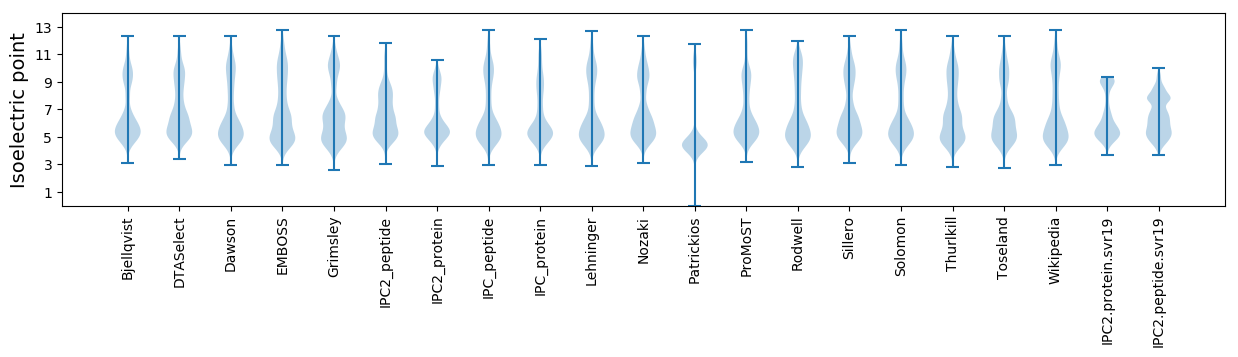
* You can choose from 21 different methods for calculating isoelectric point
Summary statistics related to proteome-wise predictions
Protein with the lowest isoelectric point:
>tr|A0A1D9M908|A0A1D9M908_9RHOB FAD-dependent oxidoreductase OS=Rhodobacter sp. LPB0142 OX=1850250 GN=LPB142_02640 PE=4 SV=1
MM1 pKa = 7.44KK2 pKa = 10.19KK3 pKa = 10.41VLFATTALVMTAGVAAAEE21 pKa = 4.39VSLSGDD27 pKa = 2.68GRR29 pKa = 11.84MGIVYY34 pKa = 10.52NGADD38 pKa = 3.18WNFSSRR44 pKa = 11.84ARR46 pKa = 11.84VTFTLSGTTDD56 pKa = 2.92NGIEE60 pKa = 4.0FGGSFRR66 pKa = 11.84ADD68 pKa = 3.17QAGDD72 pKa = 3.68SVLDD76 pKa = 3.45NGAAYY81 pKa = 9.93GSEE84 pKa = 3.78GSVYY88 pKa = 10.63VSGAFGKK95 pKa = 9.98IEE97 pKa = 3.97MGDD100 pKa = 3.28AVSAPEE106 pKa = 4.53ALFGDD111 pKa = 4.52LPEE114 pKa = 4.66VGYY117 pKa = 9.44TDD119 pKa = 3.69LTSAGGLEE127 pKa = 3.91NDD129 pKa = 3.53IPYY132 pKa = 9.23LTGDD136 pKa = 3.75GVTTLAGNPVVLYY149 pKa = 9.13TYY151 pKa = 9.17STGPISIAASMSDD164 pKa = 3.01GKK166 pKa = 10.84LGSVNDD172 pKa = 3.64QQEE175 pKa = 4.24YY176 pKa = 10.52AVAGAYY182 pKa = 8.84TYY184 pKa = 11.3EE185 pKa = 4.23NYY187 pKa = 9.67TVGFGYY193 pKa = 10.99EE194 pKa = 3.89MLEE197 pKa = 4.29DD198 pKa = 3.64VGGVAGVDD206 pKa = 3.57YY207 pKa = 9.44TQGEE211 pKa = 4.45LAGVATFGDD220 pKa = 4.17TSVKK224 pKa = 10.54AYY226 pKa = 8.62FAKK229 pKa = 10.48GGKK232 pKa = 8.48QNPVDD237 pKa = 3.47QAFGLGVTSKK247 pKa = 10.64FGATTVLGYY256 pKa = 8.17VQKK259 pKa = 11.4AEE261 pKa = 4.24FTAGGDD267 pKa = 3.71VTWYY271 pKa = 10.91GLGASYY277 pKa = 11.27DD278 pKa = 3.84LGGGASIVGGISDD291 pKa = 5.64DD292 pKa = 4.37DD293 pKa = 4.44LANTDD298 pKa = 3.41PTADD302 pKa = 3.76LGVKK306 pKa = 10.34FKK308 pKa = 11.05FF309 pKa = 3.81
MM1 pKa = 7.44KK2 pKa = 10.19KK3 pKa = 10.41VLFATTALVMTAGVAAAEE21 pKa = 4.39VSLSGDD27 pKa = 2.68GRR29 pKa = 11.84MGIVYY34 pKa = 10.52NGADD38 pKa = 3.18WNFSSRR44 pKa = 11.84ARR46 pKa = 11.84VTFTLSGTTDD56 pKa = 2.92NGIEE60 pKa = 4.0FGGSFRR66 pKa = 11.84ADD68 pKa = 3.17QAGDD72 pKa = 3.68SVLDD76 pKa = 3.45NGAAYY81 pKa = 9.93GSEE84 pKa = 3.78GSVYY88 pKa = 10.63VSGAFGKK95 pKa = 9.98IEE97 pKa = 3.97MGDD100 pKa = 3.28AVSAPEE106 pKa = 4.53ALFGDD111 pKa = 4.52LPEE114 pKa = 4.66VGYY117 pKa = 9.44TDD119 pKa = 3.69LTSAGGLEE127 pKa = 3.91NDD129 pKa = 3.53IPYY132 pKa = 9.23LTGDD136 pKa = 3.75GVTTLAGNPVVLYY149 pKa = 9.13TYY151 pKa = 9.17STGPISIAASMSDD164 pKa = 3.01GKK166 pKa = 10.84LGSVNDD172 pKa = 3.64QQEE175 pKa = 4.24YY176 pKa = 10.52AVAGAYY182 pKa = 8.84TYY184 pKa = 11.3EE185 pKa = 4.23NYY187 pKa = 9.67TVGFGYY193 pKa = 10.99EE194 pKa = 3.89MLEE197 pKa = 4.29DD198 pKa = 3.64VGGVAGVDD206 pKa = 3.57YY207 pKa = 9.44TQGEE211 pKa = 4.45LAGVATFGDD220 pKa = 4.17TSVKK224 pKa = 10.54AYY226 pKa = 8.62FAKK229 pKa = 10.48GGKK232 pKa = 8.48QNPVDD237 pKa = 3.47QAFGLGVTSKK247 pKa = 10.64FGATTVLGYY256 pKa = 8.17VQKK259 pKa = 11.4AEE261 pKa = 4.24FTAGGDD267 pKa = 3.71VTWYY271 pKa = 10.91GLGASYY277 pKa = 11.27DD278 pKa = 3.84LGGGASIVGGISDD291 pKa = 5.64DD292 pKa = 4.37DD293 pKa = 4.44LANTDD298 pKa = 3.41PTADD302 pKa = 3.76LGVKK306 pKa = 10.34FKK308 pKa = 11.05FF309 pKa = 3.81
Molecular weight: 31.52 kDa
Isoelectric point according different methods:
Protein with the highest isoelectric point:
>tr|A0A1D9M963|A0A1D9M963_9RHOB RNA pseudouridine synthase OS=Rhodobacter sp. LPB0142 OX=1850250 GN=LPB142_02200 PE=4 SV=1
MM1 pKa = 7.86DD2 pKa = 4.61FKK4 pKa = 11.26AIAMGLAFALMWSSAFTSARR24 pKa = 11.84MIVADD29 pKa = 4.87APPMAALALRR39 pKa = 11.84FLVSGLIGVGIALAVGQSWRR59 pKa = 11.84LSRR62 pKa = 11.84AQWRR66 pKa = 11.84ATLIFGLCQNALYY79 pKa = 10.72LGLNFVAMQWVQASVASIIASTMPLMVAGLGWAVFGDD116 pKa = 3.98RR117 pKa = 11.84VRR119 pKa = 11.84PLGVAGLGAGVVGVAIIMGARR140 pKa = 11.84LSGGVDD146 pKa = 3.37PVGMALCFAGALALSIATLSVRR168 pKa = 11.84GAASGGNVMMIVGLQMFVGAAILASASAAIEE199 pKa = 4.07TWEE202 pKa = 4.35VTWSARR208 pKa = 11.84LVWAFLYY215 pKa = 7.48TTLIPGVLATWVWFKK230 pKa = 11.21LVGRR234 pKa = 11.84IGAVKK239 pKa = 10.04AATFHH244 pKa = 6.31FLNPFFGVAIAALVLGEE261 pKa = 4.42RR262 pKa = 11.84LGALDD267 pKa = 4.21LLGVAVIAGGILAVQLSKK285 pKa = 10.9QAA287 pKa = 3.49
MM1 pKa = 7.86DD2 pKa = 4.61FKK4 pKa = 11.26AIAMGLAFALMWSSAFTSARR24 pKa = 11.84MIVADD29 pKa = 4.87APPMAALALRR39 pKa = 11.84FLVSGLIGVGIALAVGQSWRR59 pKa = 11.84LSRR62 pKa = 11.84AQWRR66 pKa = 11.84ATLIFGLCQNALYY79 pKa = 10.72LGLNFVAMQWVQASVASIIASTMPLMVAGLGWAVFGDD116 pKa = 3.98RR117 pKa = 11.84VRR119 pKa = 11.84PLGVAGLGAGVVGVAIIMGARR140 pKa = 11.84LSGGVDD146 pKa = 3.37PVGMALCFAGALALSIATLSVRR168 pKa = 11.84GAASGGNVMMIVGLQMFVGAAILASASAAIEE199 pKa = 4.07TWEE202 pKa = 4.35VTWSARR208 pKa = 11.84LVWAFLYY215 pKa = 7.48TTLIPGVLATWVWFKK230 pKa = 11.21LVGRR234 pKa = 11.84IGAVKK239 pKa = 10.04AATFHH244 pKa = 6.31FLNPFFGVAIAALVLGEE261 pKa = 4.42RR262 pKa = 11.84LGALDD267 pKa = 4.21LLGVAVIAGGILAVQLSKK285 pKa = 10.9QAA287 pKa = 3.49
Molecular weight: 29.58 kDa
Isoelectric point according different methods:
Peptides (in silico digests for buttom-up proteomics)
Below you can find in silico digests of the whole proteome with Trypsin, Chymotrypsin, Trypsin+LysC, LysN, ArgC proteases suitable for different mass spec machines.| Try ESI |
 |
|---|
| ChTry ESI |
|
|---|
| ArgC ESI |
|
|---|
| LysN ESI |
|
|---|
| TryLysC ESI |
|
|---|
| Try MALDI |
|
|---|
| ChTry MALDI |
|
|---|
| ArgC MALDI |
|
|---|
| LysN MALDI |
|
|---|
| TryLysC MALDI |
|
|---|
| Try LTQ |
|
|---|
| ChTry LTQ |
|
|---|
| ArgC LTQ |
|
|---|
| LysN LTQ |
|
|---|
| TryLysC LTQ |
|
|---|
| Try MSlow |
|
|---|
| ChTry MSlow |
|
|---|
| ArgC MSlow |
|
|---|
| LysN MSlow |
|
|---|
| TryLysC MSlow |
|
|---|
| Try MShigh |
|
|---|
| ChTry MShigh |
|
|---|
| ArgC MShigh |
|
|---|
| LysN MShigh |
|
|---|
| TryLysC MShigh |
|
|---|
General Statistics
Number of major isoforms |
Number of additional isoforms |
Number of all proteins |
Number of amino acids |
Min. Seq. Length |
Max. Seq. Length |
Avg. Seq. Length |
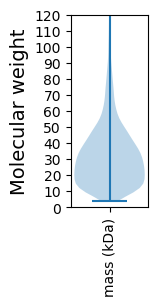
Avg. Mol. Weight |
|---|---|---|---|---|---|---|---|
0 |
1065451 |
38 |
2468 |
312.1 |
33.61 |
Amino acid frequency
Ala |
Cys |
Asp |
Glu |
Phe |
Gly |
His |
Ile |
Lys |
Leu |
|---|---|---|---|---|---|---|---|---|---|
14.408 ± 0.076 | 0.834 ± 0.013 |
5.185 ± 0.04 | 6.335 ± 0.037 |
3.586 ± 0.025 | 9.062 ± 0.049 |
1.892 ± 0.021 | 4.825 ± 0.031 |
3.006 ± 0.035 | 10.374 ± 0.063 |
Met |
Asn |
Gln |
Pro |
Arg |
Ser |
Thr |
Val |
Trp |
Tyr |
|---|---|---|---|---|---|---|---|---|---|
2.585 ± 0.02 | 2.167 ± 0.022 |
5.42 ± 0.038 | 2.855 ± 0.023 |
7.25 ± 0.048 | 4.583 ± 0.028 |
5.068 ± 0.031 | 7.046 ± 0.035 |
1.434 ± 0.02 | 2.085 ± 0.02 |
Most of the basic statistics you can see at this page can be downloaded from this CSV file
See this proteome in:

Proteome-pI is available under Creative Commons Attribution-NoDerivs license, for more details see here
| Reference: Kozlowski LP. Proteome-pI 2.0: Proteome Isoelectric Point Database Update. Nucleic Acids Res. 2021, doi: 10.1093/nar/gkab944 | Contact: Lukasz P. Kozlowski |