Natronincola peptidivorans
Taxonomy: cellular organisms; Bacteria; Terrabacteria group; Firmicutes; Clostridia; Eubacteriales; Clostridiaceae; Natronincola
Average proteome isoelectric point is 6.35
Get precalculated fractions of proteins
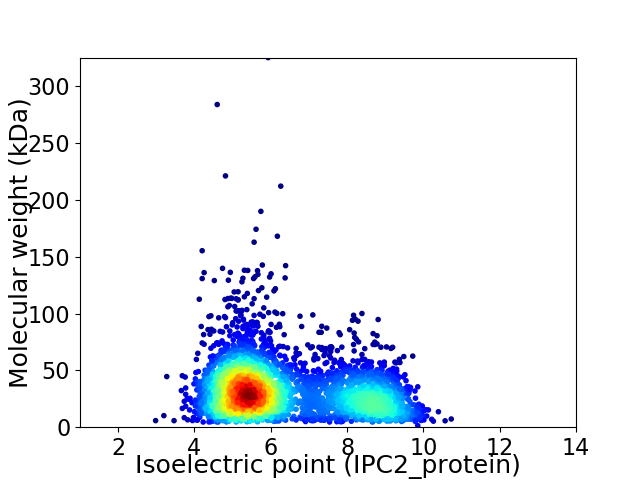
Virtual 2D-PAGE plot for 3528 proteins (isoelectric point calculated using IPC2_protein)
Get csv file with sequences according to given criteria:
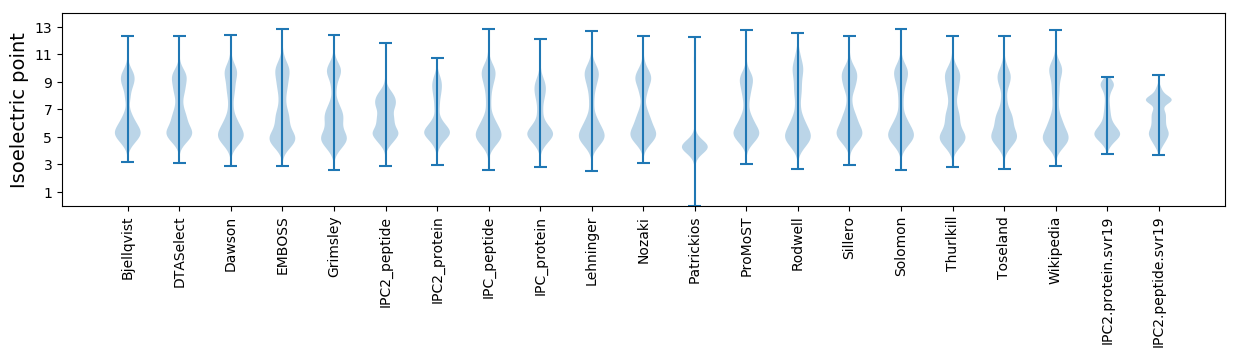
* You can choose from 21 different methods for calculating isoelectric point
Summary statistics related to proteome-wise predictions
Protein with the lowest isoelectric point:
>tr|A0A1I0E5P9|A0A1I0E5P9_9CLOT Uncharacterized protein OS=Natronincola peptidivorans OX=426128 GN=SAMN05660297_02286 PE=4 SV=1
MM1 pKa = 7.5KK2 pKa = 10.27KK3 pKa = 10.01IISLIILVLLALTIFTGCSYY23 pKa = 9.12EE24 pKa = 4.21TEE26 pKa = 4.2KK27 pKa = 11.15SEE29 pKa = 4.25EE30 pKa = 3.95ALQEE34 pKa = 4.7GITEE38 pKa = 4.48EE39 pKa = 4.11IEE41 pKa = 4.03EE42 pKa = 4.97EE43 pKa = 4.04IPQEE47 pKa = 4.02QEE49 pKa = 3.24VDD51 pKa = 3.1IADD54 pKa = 3.93EE55 pKa = 4.32NQEE58 pKa = 4.23STSDD62 pKa = 3.47FATDD66 pKa = 3.51EE67 pKa = 3.91EE68 pKa = 4.84RR69 pKa = 11.84TFYY72 pKa = 11.02LSNLRR77 pKa = 11.84NGDD80 pKa = 3.61EE81 pKa = 4.18VGEE84 pKa = 4.06GLIIRR89 pKa = 11.84DD90 pKa = 3.38IYY92 pKa = 10.96IEE94 pKa = 4.33DD95 pKa = 4.44EE96 pKa = 4.19YY97 pKa = 11.3TSFILAGDD105 pKa = 3.62IALTGEE111 pKa = 4.47LSYY114 pKa = 11.44DD115 pKa = 3.36HH116 pKa = 6.87QYY118 pKa = 10.17YY119 pKa = 9.56EE120 pKa = 4.97AMMFTFPDD128 pKa = 4.72DD129 pKa = 3.39IFPTIVIEE137 pKa = 4.38GEE139 pKa = 4.56GYY141 pKa = 9.03NQEE144 pKa = 4.75HH145 pKa = 6.89IEE147 pKa = 4.09FTYY150 pKa = 10.49KK151 pKa = 10.19PSHH154 pKa = 5.16FVFRR158 pKa = 11.84NEE160 pKa = 3.88DD161 pKa = 3.47ALFEE165 pKa = 4.6ALPHH169 pKa = 6.41SDD171 pKa = 3.72LIEE174 pKa = 4.37VIEE177 pKa = 4.54EE178 pKa = 4.23GKK180 pKa = 9.0TMNVGIGVKK189 pKa = 9.99DD190 pKa = 3.89LNFIGYY196 pKa = 7.04WQSEE200 pKa = 4.33YY201 pKa = 10.6GASVEE206 pKa = 4.07FVEE209 pKa = 6.27IIDD212 pKa = 4.08IMM214 pKa = 4.29
MM1 pKa = 7.5KK2 pKa = 10.27KK3 pKa = 10.01IISLIILVLLALTIFTGCSYY23 pKa = 9.12EE24 pKa = 4.21TEE26 pKa = 4.2KK27 pKa = 11.15SEE29 pKa = 4.25EE30 pKa = 3.95ALQEE34 pKa = 4.7GITEE38 pKa = 4.48EE39 pKa = 4.11IEE41 pKa = 4.03EE42 pKa = 4.97EE43 pKa = 4.04IPQEE47 pKa = 4.02QEE49 pKa = 3.24VDD51 pKa = 3.1IADD54 pKa = 3.93EE55 pKa = 4.32NQEE58 pKa = 4.23STSDD62 pKa = 3.47FATDD66 pKa = 3.51EE67 pKa = 3.91EE68 pKa = 4.84RR69 pKa = 11.84TFYY72 pKa = 11.02LSNLRR77 pKa = 11.84NGDD80 pKa = 3.61EE81 pKa = 4.18VGEE84 pKa = 4.06GLIIRR89 pKa = 11.84DD90 pKa = 3.38IYY92 pKa = 10.96IEE94 pKa = 4.33DD95 pKa = 4.44EE96 pKa = 4.19YY97 pKa = 11.3TSFILAGDD105 pKa = 3.62IALTGEE111 pKa = 4.47LSYY114 pKa = 11.44DD115 pKa = 3.36HH116 pKa = 6.87QYY118 pKa = 10.17YY119 pKa = 9.56EE120 pKa = 4.97AMMFTFPDD128 pKa = 4.72DD129 pKa = 3.39IFPTIVIEE137 pKa = 4.38GEE139 pKa = 4.56GYY141 pKa = 9.03NQEE144 pKa = 4.75HH145 pKa = 6.89IEE147 pKa = 4.09FTYY150 pKa = 10.49KK151 pKa = 10.19PSHH154 pKa = 5.16FVFRR158 pKa = 11.84NEE160 pKa = 3.88DD161 pKa = 3.47ALFEE165 pKa = 4.6ALPHH169 pKa = 6.41SDD171 pKa = 3.72LIEE174 pKa = 4.37VIEE177 pKa = 4.54EE178 pKa = 4.23GKK180 pKa = 9.0TMNVGIGVKK189 pKa = 9.99DD190 pKa = 3.89LNFIGYY196 pKa = 7.04WQSEE200 pKa = 4.33YY201 pKa = 10.6GASVEE206 pKa = 4.07FVEE209 pKa = 6.27IIDD212 pKa = 4.08IMM214 pKa = 4.29
Molecular weight: 24.52 kDa
Isoelectric point according different methods:
Protein with the highest isoelectric point:
>tr|A0A1I0GAZ5|A0A1I0GAZ5_9CLOT AhpC/TSA family protein OS=Natronincola peptidivorans OX=426128 GN=SAMN05660297_03124 PE=4 SV=1
MM1 pKa = 7.74ALHH4 pKa = 6.6KK5 pKa = 10.75NKK7 pKa = 9.71FMEE10 pKa = 5.32FIEE13 pKa = 4.81GRR15 pKa = 11.84LLLLIGISTTMIGLFSPWVRR35 pKa = 11.84IEE37 pKa = 3.95WKK39 pKa = 9.84HH40 pKa = 5.51SRR42 pKa = 11.84GILDD46 pKa = 3.53STGMIIFCILIYY58 pKa = 10.02LTMIKK63 pKa = 9.98RR64 pKa = 11.84IAGYY68 pKa = 10.02RR69 pKa = 11.84IIASSIAIAILMAVQFMNFPRR90 pKa = 11.84IMNITWEE97 pKa = 4.09RR98 pKa = 11.84SFGFSMTYY106 pKa = 9.41VQTGFFITLFGVLLMMLAGFIKK128 pKa = 9.96QRR130 pKa = 11.84QGIRR134 pKa = 3.19
MM1 pKa = 7.74ALHH4 pKa = 6.6KK5 pKa = 10.75NKK7 pKa = 9.71FMEE10 pKa = 5.32FIEE13 pKa = 4.81GRR15 pKa = 11.84LLLLIGISTTMIGLFSPWVRR35 pKa = 11.84IEE37 pKa = 3.95WKK39 pKa = 9.84HH40 pKa = 5.51SRR42 pKa = 11.84GILDD46 pKa = 3.53STGMIIFCILIYY58 pKa = 10.02LTMIKK63 pKa = 9.98RR64 pKa = 11.84IAGYY68 pKa = 10.02RR69 pKa = 11.84IIASSIAIAILMAVQFMNFPRR90 pKa = 11.84IMNITWEE97 pKa = 4.09RR98 pKa = 11.84SFGFSMTYY106 pKa = 9.41VQTGFFITLFGVLLMMLAGFIKK128 pKa = 9.96QRR130 pKa = 11.84QGIRR134 pKa = 3.19
Molecular weight: 15.48 kDa
Isoelectric point according different methods:
Peptides (in silico digests for buttom-up proteomics)
Below you can find in silico digests of the whole proteome with Trypsin, Chymotrypsin, Trypsin+LysC, LysN, ArgC proteases suitable for different mass spec machines.| Try ESI |
 |
|---|
| ChTry ESI |
|
|---|
| ArgC ESI |
|
|---|
| LysN ESI |
|
|---|
| TryLysC ESI |
|
|---|
| Try MALDI |
|
|---|
| ChTry MALDI |
|
|---|
| ArgC MALDI |
|
|---|
| LysN MALDI |
|
|---|
| TryLysC MALDI |
|
|---|
| Try LTQ |
|
|---|
| ChTry LTQ |
|
|---|
| ArgC LTQ |
|
|---|
| LysN LTQ |
|
|---|
| TryLysC LTQ |
|
|---|
| Try MSlow |
|
|---|
| ChTry MSlow |
|
|---|
| ArgC MSlow |
|
|---|
| LysN MSlow |
|
|---|
| TryLysC MSlow |
|
|---|
| Try MShigh |
|
|---|
| ChTry MShigh |
|
|---|
| ArgC MShigh |
|
|---|
| LysN MShigh |
|
|---|
| TryLysC MShigh |
|
|---|
General Statistics
Number of major isoforms |
Number of additional isoforms |
Number of all proteins |
Number of amino acids |
Min. Seq. Length |
Max. Seq. Length |
Avg. Seq. Length |
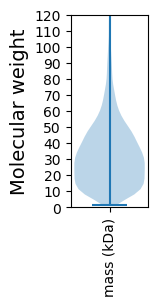
Avg. Mol. Weight |
|---|---|---|---|---|---|---|---|
0 |
1074561 |
11 |
2835 |
304.6 |
34.26 |
Amino acid frequency
Ala |
Cys |
Asp |
Glu |
Phe |
Gly |
His |
Ile |
Lys |
Leu |
|---|---|---|---|---|---|---|---|---|---|
6.577 ± 0.044 | 0.92 ± 0.014 |
5.154 ± 0.03 | 7.917 ± 0.044 |
4.086 ± 0.035 | 6.862 ± 0.047 |
1.816 ± 0.015 | 9.532 ± 0.049 |
7.774 ± 0.049 | 9.341 ± 0.045 |
Met |
Asn |
Gln |
Pro |
Arg |
Ser |
Thr |
Val |
Trp |
Tyr |
|---|---|---|---|---|---|---|---|---|---|
2.857 ± 0.018 | 4.957 ± 0.032 |
3.245 ± 0.025 | 3.17 ± 0.028 |
3.832 ± 0.027 | 5.508 ± 0.028 |
5.258 ± 0.034 | 6.622 ± 0.039 |
0.761 ± 0.014 | 3.812 ± 0.031 |
Most of the basic statistics you can see at this page can be downloaded from this CSV file
See this proteome in:

Proteome-pI is available under Creative Commons Attribution-NoDerivs license, for more details see here
| Reference: Kozlowski LP. Proteome-pI 2.0: Proteome Isoelectric Point Database Update. Nucleic Acids Res. 2021, doi: 10.1093/nar/gkab944 | Contact: Lukasz P. Kozlowski |