Aeromicrobium terrae
Taxonomy: cellular organisms; Bacteria; Terrabacteria group; Actinobacteria; Actinomycetia; Propionibacteriales; Nocardioidaceae; Aeromicrobium
Average proteome isoelectric point is 5.85
Get precalculated fractions of proteins
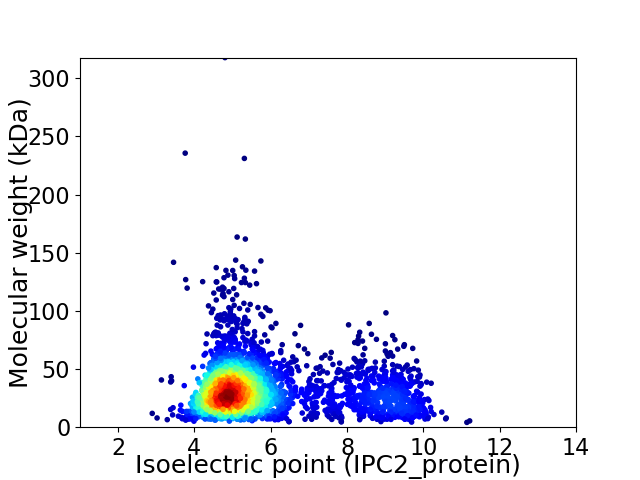
Virtual 2D-PAGE plot for 3087 proteins (isoelectric point calculated using IPC2_protein)
Get csv file with sequences according to given criteria:
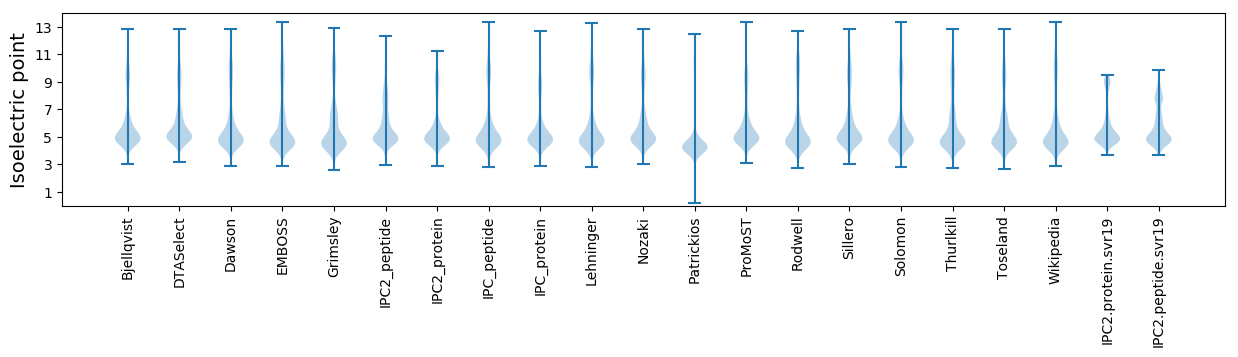
* You can choose from 21 different methods for calculating isoelectric point
Summary statistics related to proteome-wise predictions
Protein with the lowest isoelectric point:
>tr|A0A5C8NNS0|A0A5C8NNS0_9ACTN Imidazoleglycerol-phosphate dehydratase OS=Aeromicrobium terrae OX=2498846 GN=hisB PE=3 SV=1
MM1 pKa = 7.75RR2 pKa = 11.84IEE4 pKa = 4.13SRR6 pKa = 11.84GVLAAVLTVFTLVGAGLLAVASPAGAATANISAEE40 pKa = 4.23CTPDD44 pKa = 3.44GNKK47 pKa = 8.78LTVEE51 pKa = 4.13LSGYY55 pKa = 10.64NSGNPSTVVLYY66 pKa = 10.57INDD69 pKa = 3.85SVFIAAGFFEE79 pKa = 5.1GFSGSYY85 pKa = 10.15SADD88 pKa = 3.2PTIDD92 pKa = 3.64VTWKK96 pKa = 10.0VQVTSSDD103 pKa = 3.98DD104 pKa = 3.65PDD106 pKa = 3.78GTTGATFTKK115 pKa = 9.64TISVDD120 pKa = 3.11ACVSSVTPQDD130 pKa = 3.39PTVTQAQCSGPGEE143 pKa = 4.28HH144 pKa = 7.1SDD146 pKa = 3.64PVVTFATGPDD156 pKa = 3.69HH157 pKa = 6.6VTYY160 pKa = 10.36DD161 pKa = 3.79YY162 pKa = 11.85DD163 pKa = 4.24DD164 pKa = 3.91ATHH167 pKa = 7.15LVTATAVATSDD178 pKa = 2.9MTYY181 pKa = 10.79RR182 pKa = 11.84FDD184 pKa = 3.67TVPAGWTKK192 pKa = 10.72VDD194 pKa = 3.52DD195 pKa = 3.61THH197 pKa = 6.87ATFEE201 pKa = 4.36VTLTDD206 pKa = 3.92PGTCIVEE213 pKa = 4.21VTPTPPTVVPAQTCGDD229 pKa = 3.73DD230 pKa = 4.05VLNVPADD237 pKa = 3.81TAGITYY243 pKa = 8.69TRR245 pKa = 11.84ADD247 pKa = 4.14DD248 pKa = 4.56GSSVTATAGTGYY260 pKa = 9.67EE261 pKa = 4.17LPGGARR267 pKa = 11.84SQTWTNRR274 pKa = 11.84VDD276 pKa = 3.51YY277 pKa = 10.74EE278 pKa = 4.27YY279 pKa = 9.94DD280 pKa = 3.21TVANGGAEE288 pKa = 4.18ACPDD292 pKa = 3.85PPGDD296 pKa = 4.1PDD298 pKa = 4.36DD299 pKa = 5.44PGVSDD304 pKa = 3.96SSGPAADD311 pKa = 4.24ISDD314 pKa = 4.04SSGVLPDD321 pKa = 4.16TGSSMTPVVLGIALALLVGGCLVVRR346 pKa = 11.84RR347 pKa = 11.84RR348 pKa = 11.84LTT350 pKa = 3.15
MM1 pKa = 7.75RR2 pKa = 11.84IEE4 pKa = 4.13SRR6 pKa = 11.84GVLAAVLTVFTLVGAGLLAVASPAGAATANISAEE40 pKa = 4.23CTPDD44 pKa = 3.44GNKK47 pKa = 8.78LTVEE51 pKa = 4.13LSGYY55 pKa = 10.64NSGNPSTVVLYY66 pKa = 10.57INDD69 pKa = 3.85SVFIAAGFFEE79 pKa = 5.1GFSGSYY85 pKa = 10.15SADD88 pKa = 3.2PTIDD92 pKa = 3.64VTWKK96 pKa = 10.0VQVTSSDD103 pKa = 3.98DD104 pKa = 3.65PDD106 pKa = 3.78GTTGATFTKK115 pKa = 9.64TISVDD120 pKa = 3.11ACVSSVTPQDD130 pKa = 3.39PTVTQAQCSGPGEE143 pKa = 4.28HH144 pKa = 7.1SDD146 pKa = 3.64PVVTFATGPDD156 pKa = 3.69HH157 pKa = 6.6VTYY160 pKa = 10.36DD161 pKa = 3.79YY162 pKa = 11.85DD163 pKa = 4.24DD164 pKa = 3.91ATHH167 pKa = 7.15LVTATAVATSDD178 pKa = 2.9MTYY181 pKa = 10.79RR182 pKa = 11.84FDD184 pKa = 3.67TVPAGWTKK192 pKa = 10.72VDD194 pKa = 3.52DD195 pKa = 3.61THH197 pKa = 6.87ATFEE201 pKa = 4.36VTLTDD206 pKa = 3.92PGTCIVEE213 pKa = 4.21VTPTPPTVVPAQTCGDD229 pKa = 3.73DD230 pKa = 4.05VLNVPADD237 pKa = 3.81TAGITYY243 pKa = 8.69TRR245 pKa = 11.84ADD247 pKa = 4.14DD248 pKa = 4.56GSSVTATAGTGYY260 pKa = 9.67EE261 pKa = 4.17LPGGARR267 pKa = 11.84SQTWTNRR274 pKa = 11.84VDD276 pKa = 3.51YY277 pKa = 10.74EE278 pKa = 4.27YY279 pKa = 9.94DD280 pKa = 3.21TVANGGAEE288 pKa = 4.18ACPDD292 pKa = 3.85PPGDD296 pKa = 4.1PDD298 pKa = 4.36DD299 pKa = 5.44PGVSDD304 pKa = 3.96SSGPAADD311 pKa = 4.24ISDD314 pKa = 4.04SSGVLPDD321 pKa = 4.16TGSSMTPVVLGIALALLVGGCLVVRR346 pKa = 11.84RR347 pKa = 11.84RR348 pKa = 11.84LTT350 pKa = 3.15
Molecular weight: 35.72 kDa
Isoelectric point according different methods:
Protein with the highest isoelectric point:
>tr|A0A5C8NG56|A0A5C8NG56_9ACTN 2-oxoacid:ferredoxin oxidoreductase subunit beta OS=Aeromicrobium terrae OX=2498846 GN=FHP06_12475 PE=4 SV=1
MM1 pKa = 7.4GSVIKK6 pKa = 10.38KK7 pKa = 8.42RR8 pKa = 11.84RR9 pKa = 11.84KK10 pKa = 9.06RR11 pKa = 11.84MSKK14 pKa = 9.63KK15 pKa = 9.56KK16 pKa = 9.27HH17 pKa = 5.36RR18 pKa = 11.84KK19 pKa = 5.5MLKK22 pKa = 7.41RR23 pKa = 11.84TRR25 pKa = 11.84VQRR28 pKa = 11.84RR29 pKa = 11.84KK30 pKa = 10.11LGKK33 pKa = 9.87
MM1 pKa = 7.4GSVIKK6 pKa = 10.38KK7 pKa = 8.42RR8 pKa = 11.84RR9 pKa = 11.84KK10 pKa = 9.06RR11 pKa = 11.84MSKK14 pKa = 9.63KK15 pKa = 9.56KK16 pKa = 9.27HH17 pKa = 5.36RR18 pKa = 11.84KK19 pKa = 5.5MLKK22 pKa = 7.41RR23 pKa = 11.84TRR25 pKa = 11.84VQRR28 pKa = 11.84RR29 pKa = 11.84KK30 pKa = 10.11LGKK33 pKa = 9.87
Molecular weight: 4.14 kDa
Isoelectric point according different methods:
Peptides (in silico digests for buttom-up proteomics)
Below you can find in silico digests of the whole proteome with Trypsin, Chymotrypsin, Trypsin+LysC, LysN, ArgC proteases suitable for different mass spec machines.| Try ESI |
 |
|---|
| ChTry ESI |
|
|---|
| ArgC ESI |
|
|---|
| LysN ESI |
|
|---|
| TryLysC ESI |
|
|---|
| Try MALDI |
|
|---|
| ChTry MALDI |
|
|---|
| ArgC MALDI |
|
|---|
| LysN MALDI |
|
|---|
| TryLysC MALDI |
|
|---|
| Try LTQ |
|
|---|
| ChTry LTQ |
|
|---|
| ArgC LTQ |
|
|---|
| LysN LTQ |
|
|---|
| TryLysC LTQ |
|
|---|
| Try MSlow |
|
|---|
| ChTry MSlow |
|
|---|
| ArgC MSlow |
|
|---|
| LysN MSlow |
|
|---|
| TryLysC MSlow |
|
|---|
| Try MShigh |
|
|---|
| ChTry MShigh |
|
|---|
| ArgC MShigh |
|
|---|
| LysN MShigh |
|
|---|
| TryLysC MShigh |
|
|---|
General Statistics
Number of major isoforms |
Number of additional isoforms |
Number of all proteins |
Number of amino acids |
Min. Seq. Length |
Max. Seq. Length |
Avg. Seq. Length |
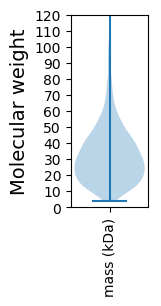
Avg. Mol. Weight |
|---|---|---|---|---|---|---|---|
0 |
983032 |
33 |
3029 |
318.4 |
34.22 |
Amino acid frequency
Ala |
Cys |
Asp |
Glu |
Phe |
Gly |
His |
Ile |
Lys |
Leu |
|---|---|---|---|---|---|---|---|---|---|
12.484 ± 0.066 | 0.69 ± 0.012 |
6.839 ± 0.038 | 5.873 ± 0.046 |
2.941 ± 0.028 | 8.928 ± 0.042 |
2.202 ± 0.022 | 3.932 ± 0.033 |
2.443 ± 0.045 | 9.997 ± 0.046 |
Met |
Asn |
Gln |
Pro |
Arg |
Ser |
Thr |
Val |
Trp |
Tyr |
|---|---|---|---|---|---|---|---|---|---|
1.949 ± 0.019 | 1.873 ± 0.026 |
5.285 ± 0.026 | 2.777 ± 0.022 |
7.269 ± 0.054 | 5.445 ± 0.034 |
6.134 ± 0.049 | 9.516 ± 0.045 |
1.454 ± 0.019 | 1.968 ± 0.022 |
Most of the basic statistics you can see at this page can be downloaded from this CSV file
See this proteome in:

Proteome-pI is available under Creative Commons Attribution-NoDerivs license, for more details see here
| Reference: Kozlowski LP. Proteome-pI 2.0: Proteome Isoelectric Point Database Update. Nucleic Acids Res. 2021, doi: 10.1093/nar/gkab944 | Contact: Lukasz P. Kozlowski |