Pyrobaculum filamentous virus 2
Taxonomy: Viruses; Adnaviria; Zilligvirae; Taleaviricota; Tokiviricetes; Primavirales; Tristromaviridae; Alphatristromavirus; Alphatristromavirus PFV2
Average proteome isoelectric point is 6.47
Get precalculated fractions of proteins
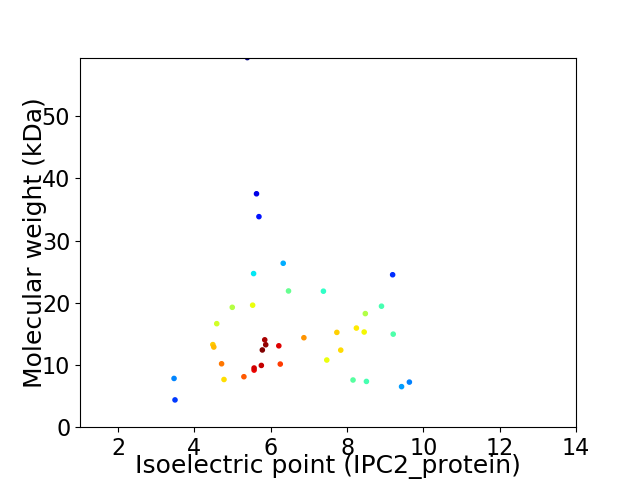
Virtual 2D-PAGE plot for 39 proteins (isoelectric point calculated using IPC2_protein)
Get csv file with sequences according to given criteria:
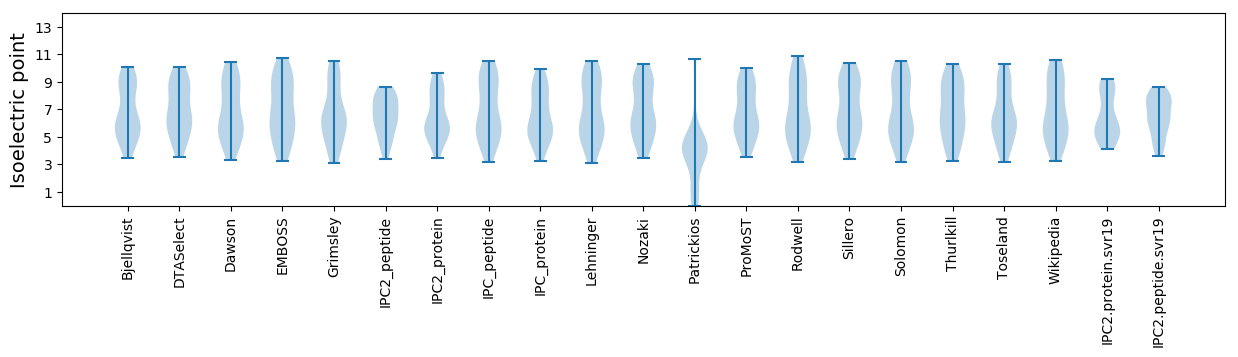
* You can choose from 21 different methods for calculating isoelectric point
Summary statistics related to proteome-wise predictions
Protein with the lowest isoelectric point:
>tr|A0A6M3VXP5|A0A6M3VXP5_9VIRU Uncharacterized protein OS=Pyrobaculum filamentous virus 2 OX=2730621 GN=PFV2_gp14 PE=4 SV=1
MM1 pKa = 7.68IDD3 pKa = 3.89EE4 pKa = 4.74PLEE7 pKa = 4.38APSVSCEE14 pKa = 3.92EE15 pKa = 3.88LMEE18 pKa = 3.88MCMRR22 pKa = 11.84VGGMWCEE29 pKa = 5.18DD30 pKa = 3.17YY31 pKa = 11.17DD32 pKa = 4.14ALCGEE37 pKa = 4.95DD38 pKa = 3.39VV39 pKa = 3.39
MM1 pKa = 7.68IDD3 pKa = 3.89EE4 pKa = 4.74PLEE7 pKa = 4.38APSVSCEE14 pKa = 3.92EE15 pKa = 3.88LMEE18 pKa = 3.88MCMRR22 pKa = 11.84VGGMWCEE29 pKa = 5.18DD30 pKa = 3.17YY31 pKa = 11.17DD32 pKa = 4.14ALCGEE37 pKa = 4.95DD38 pKa = 3.39VV39 pKa = 3.39
Molecular weight: 4.39 kDa
Isoelectric point according different methods:
Protein with the highest isoelectric point:
>tr|A0A6M3VZ93|A0A6M3VZ93_9VIRU Uncharacterized protein OS=Pyrobaculum filamentous virus 2 OX=2730621 GN=PFV2_gp22 PE=4 SV=1
MM1 pKa = 7.43KK2 pKa = 10.04LVKK5 pKa = 10.58GFVEE9 pKa = 4.62RR10 pKa = 11.84MRR12 pKa = 11.84SVAEE16 pKa = 3.96VLSDD20 pKa = 3.67RR21 pKa = 11.84RR22 pKa = 11.84WIEE25 pKa = 3.23FWDD28 pKa = 3.74NVNRR32 pKa = 11.84MLDD35 pKa = 3.39SGDD38 pKa = 2.74WRR40 pKa = 11.84FRR42 pKa = 11.84AVVKK46 pKa = 10.39KK47 pKa = 9.86VYY49 pKa = 10.33KK50 pKa = 10.39VIYY53 pKa = 9.86
MM1 pKa = 7.43KK2 pKa = 10.04LVKK5 pKa = 10.58GFVEE9 pKa = 4.62RR10 pKa = 11.84MRR12 pKa = 11.84SVAEE16 pKa = 3.96VLSDD20 pKa = 3.67RR21 pKa = 11.84RR22 pKa = 11.84WIEE25 pKa = 3.23FWDD28 pKa = 3.74NVNRR32 pKa = 11.84MLDD35 pKa = 3.39SGDD38 pKa = 2.74WRR40 pKa = 11.84FRR42 pKa = 11.84AVVKK46 pKa = 10.39KK47 pKa = 9.86VYY49 pKa = 10.33KK50 pKa = 10.39VIYY53 pKa = 9.86
Molecular weight: 6.52 kDa
Isoelectric point according different methods:
Peptides (in silico digests for buttom-up proteomics)
Below you can find in silico digests of the whole proteome with Trypsin, Chymotrypsin, Trypsin+LysC, LysN, ArgC proteases suitable for different mass spec machines.| Try ESI |
 |
|---|
| ChTry ESI |
|
|---|
| ArgC ESI |
|
|---|
| LysN ESI |
|
|---|
| TryLysC ESI |
|
|---|
| Try MALDI |
|
|---|
| ChTry MALDI |
|
|---|
| ArgC MALDI |
|
|---|
| LysN MALDI |
|
|---|
| TryLysC MALDI |
|
|---|
| Try LTQ |
|
|---|
| ChTry LTQ |
|
|---|
| ArgC LTQ |
|
|---|
| LysN LTQ |
|
|---|
| TryLysC LTQ |
|
|---|
| Try MSlow |
|
|---|
| ChTry MSlow |
|
|---|
| ArgC MSlow |
|
|---|
| LysN MSlow |
|
|---|
| TryLysC MSlow |
|
|---|
| Try MShigh |
|
|---|
| ChTry MShigh |
|
|---|
| ArgC MShigh |
|
|---|
| LysN MShigh |
|
|---|
| TryLysC MShigh |
|
|---|
General Statistics
Number of major isoforms |
Number of additional isoforms |
Number of all proteins |
Number of amino acids |
Min. Seq. Length |
Max. Seq. Length |
Avg. Seq. Length |
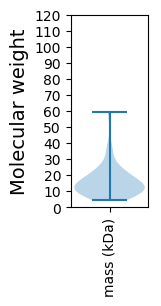
Avg. Mol. Weight |
|---|---|---|---|---|---|---|---|
0 |
5520 |
39 |
545 |
141.5 |
16.08 |
Amino acid frequency
Ala |
Cys |
Asp |
Glu |
Phe |
Gly |
His |
Ile |
Lys |
Leu |
|---|---|---|---|---|---|---|---|---|---|
6.467 ± 0.51 | 1.938 ± 0.283 |
5.96 ± 0.368 | 6.159 ± 0.604 |
4.42 ± 0.356 | 7.591 ± 0.517 |
1.359 ± 0.192 | 6.667 ± 0.402 |
5.29 ± 0.425 | 7.138 ± 0.388 |
Met |
Asn |
Gln |
Pro |
Arg |
Ser |
Thr |
Val |
Trp |
Tyr |
|---|---|---|---|---|---|---|---|---|---|
3.152 ± 0.347 | 3.514 ± 0.374 |
3.351 ± 0.479 | 1.522 ± 0.186 |
6.141 ± 0.474 | 5.217 ± 0.366 |
4.928 ± 0.771 | 11.359 ± 0.601 |
2.138 ± 0.179 | 5.688 ± 0.45 |
Most of the basic statistics you can see at this page can be downloaded from this CSV file
See this proteome in:

Proteome-pI is available under Creative Commons Attribution-NoDerivs license, for more details see here
| Reference: Kozlowski LP. Proteome-pI 2.0: Proteome Isoelectric Point Database Update. Nucleic Acids Res. 2021, doi: 10.1093/nar/gkab944 | Contact: Lukasz P. Kozlowski |