Corynebacterium heidelbergense
Taxonomy: cellular organisms; Bacteria; Terrabacteria group; Actinobacteria; Actinomycetia; Corynebacteriales; Corynebacteriaceae; Corynebacterium
Average proteome isoelectric point is 6.28
Get precalculated fractions of proteins
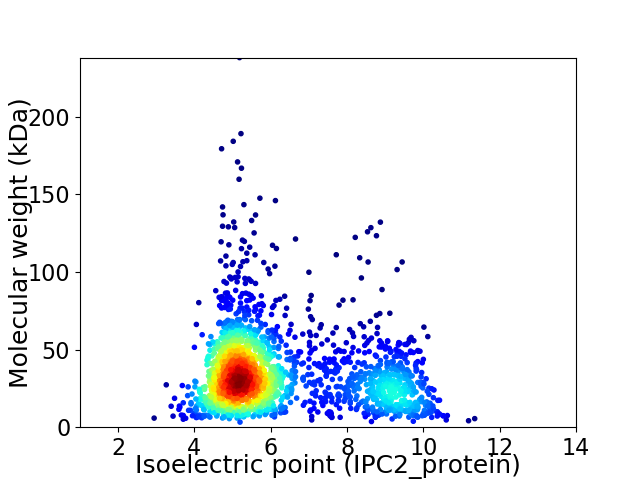
Virtual 2D-PAGE plot for 1960 proteins (isoelectric point calculated using IPC2_protein)
Get csv file with sequences according to given criteria:
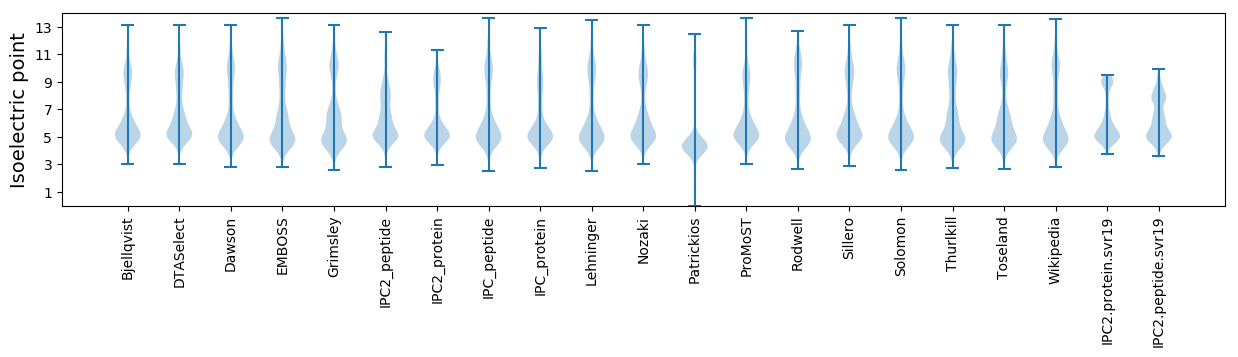
* You can choose from 21 different methods for calculating isoelectric point
Summary statistics related to proteome-wise predictions
Protein with the lowest isoelectric point:
>tr|A0A364V7Z4|A0A364V7Z4_9CORY DUF2993 domain-containing protein OS=Corynebacterium heidelbergense OX=2055947 GN=DLJ54_01785 PE=4 SV=1
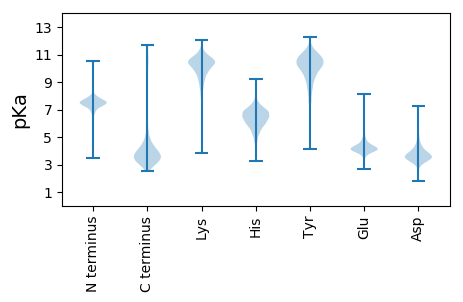
MM1 pKa = 7.57LNGPTTFDD9 pKa = 3.24VDD11 pKa = 3.73GMSCEE16 pKa = 3.98HH17 pKa = 7.0CVRR20 pKa = 11.84AVTNAVSAIPGASDD34 pKa = 3.14VRR36 pKa = 11.84VDD38 pKa = 4.05LGSGTVAFVAADD50 pKa = 3.65VPEE53 pKa = 4.32VAVVDD58 pKa = 5.22AIDD61 pKa = 3.99DD62 pKa = 3.92AGYY65 pKa = 10.58DD66 pKa = 3.69ATLHH70 pKa = 5.98HH71 pKa = 7.05APP73 pKa = 4.36
MM1 pKa = 7.57LNGPTTFDD9 pKa = 3.24VDD11 pKa = 3.73GMSCEE16 pKa = 3.98HH17 pKa = 7.0CVRR20 pKa = 11.84AVTNAVSAIPGASDD34 pKa = 3.14VRR36 pKa = 11.84VDD38 pKa = 4.05LGSGTVAFVAADD50 pKa = 3.65VPEE53 pKa = 4.32VAVVDD58 pKa = 5.22AIDD61 pKa = 3.99DD62 pKa = 3.92AGYY65 pKa = 10.58DD66 pKa = 3.69ATLHH70 pKa = 5.98HH71 pKa = 7.05APP73 pKa = 4.36
Molecular weight: 7.38 kDa
Isoelectric point according different methods:
Protein with the highest isoelectric point:
>tr|A0A364V8G2|A0A364V8G2_9CORY Fumarate reductase/succinate dehydrogenase flavoprotein subunit OS=Corynebacterium heidelbergense OX=2055947 GN=DLJ54_01085 PE=4 SV=1
MM1 pKa = 7.69AKK3 pKa = 10.06GKK5 pKa = 8.69RR6 pKa = 11.84TFQPNNRR13 pKa = 11.84RR14 pKa = 11.84RR15 pKa = 11.84ARR17 pKa = 11.84VHH19 pKa = 5.99GFRR22 pKa = 11.84TRR24 pKa = 11.84MRR26 pKa = 11.84TRR28 pKa = 11.84AGRR31 pKa = 11.84AVVSARR37 pKa = 11.84RR38 pKa = 11.84RR39 pKa = 11.84KK40 pKa = 9.2GRR42 pKa = 11.84KK43 pKa = 6.84TLTAA47 pKa = 4.25
MM1 pKa = 7.69AKK3 pKa = 10.06GKK5 pKa = 8.69RR6 pKa = 11.84TFQPNNRR13 pKa = 11.84RR14 pKa = 11.84RR15 pKa = 11.84ARR17 pKa = 11.84VHH19 pKa = 5.99GFRR22 pKa = 11.84TRR24 pKa = 11.84MRR26 pKa = 11.84TRR28 pKa = 11.84AGRR31 pKa = 11.84AVVSARR37 pKa = 11.84RR38 pKa = 11.84RR39 pKa = 11.84KK40 pKa = 9.2GRR42 pKa = 11.84KK43 pKa = 6.84TLTAA47 pKa = 4.25
Molecular weight: 5.52 kDa
Isoelectric point according different methods:
Peptides (in silico digests for buttom-up proteomics)
Below you can find in silico digests of the whole proteome with Trypsin, Chymotrypsin, Trypsin+LysC, LysN, ArgC proteases suitable for different mass spec machines.| Try ESI |
 |
|---|
| ChTry ESI |
|
|---|
| ArgC ESI |
|
|---|
| LysN ESI |
|
|---|
| TryLysC ESI |
|
|---|
| Try MALDI |
|
|---|
| ChTry MALDI |
|
|---|
| ArgC MALDI |
|
|---|
| LysN MALDI |
|
|---|
| TryLysC MALDI |
|
|---|
| Try LTQ |
|
|---|
| ChTry LTQ |
|
|---|
| ArgC LTQ |
|
|---|
| LysN LTQ |
|
|---|
| TryLysC LTQ |
|
|---|
| Try MSlow |
|
|---|
| ChTry MSlow |
|
|---|
| ArgC MSlow |
|
|---|
| LysN MSlow |
|
|---|
| TryLysC MSlow |
|
|---|
| Try MShigh |
|
|---|
| ChTry MShigh |
|
|---|
| ArgC MShigh |
|
|---|
| LysN MShigh |
|
|---|
| TryLysC MShigh |
|
|---|
General Statistics
Number of major isoforms |
Number of additional isoforms |
Number of all proteins |
Number of amino acids |
Min. Seq. Length |
Max. Seq. Length |
Avg. Seq. Length |
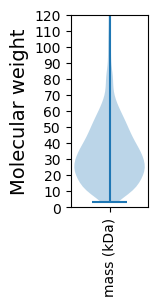
Avg. Mol. Weight |
|---|---|---|---|---|---|---|---|
0 |
659679 |
30 |
2172 |
336.6 |
36.28 |
Amino acid frequency
Ala |
Cys |
Asp |
Glu |
Phe |
Gly |
His |
Ile |
Lys |
Leu |
|---|---|---|---|---|---|---|---|---|---|
12.171 ± 0.07 | 0.769 ± 0.015 |
5.741 ± 0.049 | 6.033 ± 0.051 |
3.055 ± 0.032 | 9.038 ± 0.053 |
2.274 ± 0.026 | 4.389 ± 0.043 |
2.847 ± 0.043 | 9.308 ± 0.054 |
Met |
Asn |
Gln |
Pro |
Arg |
Ser |
Thr |
Val |
Trp |
Tyr |
|---|---|---|---|---|---|---|---|---|---|
2.139 ± 0.024 | 2.629 ± 0.034 |
5.616 ± 0.045 | 3.642 ± 0.034 |
6.978 ± 0.056 | 5.78 ± 0.039 |
5.852 ± 0.035 | 8.22 ± 0.046 |
1.395 ± 0.024 | 2.123 ± 0.027 |
Most of the basic statistics you can see at this page can be downloaded from this CSV file
See this proteome in:

Proteome-pI is available under Creative Commons Attribution-NoDerivs license, for more details see here
| Reference: Kozlowski LP. Proteome-pI 2.0: Proteome Isoelectric Point Database Update. Nucleic Acids Res. 2021, doi: 10.1093/nar/gkab944 | Contact: Lukasz P. Kozlowski |