Bat mastadenovirus WIV11
Taxonomy: Viruses; Varidnaviria; Bamfordvirae; Preplasmiviricota; Tectiliviricetes; Rowavirales; Adenoviridae; Mastadenovirus; Bat mastadenovirus C
Average proteome isoelectric point is 6.52
Get precalculated fractions of proteins
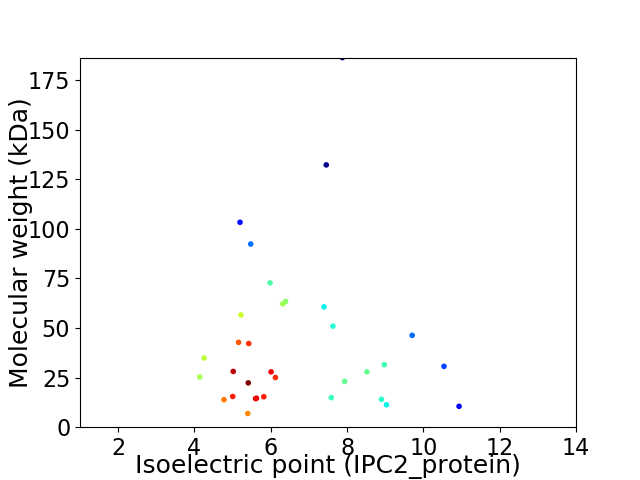
Virtual 2D-PAGE plot for 33 proteins (isoelectric point calculated using IPC2_protein)
Get csv file with sequences according to given criteria:
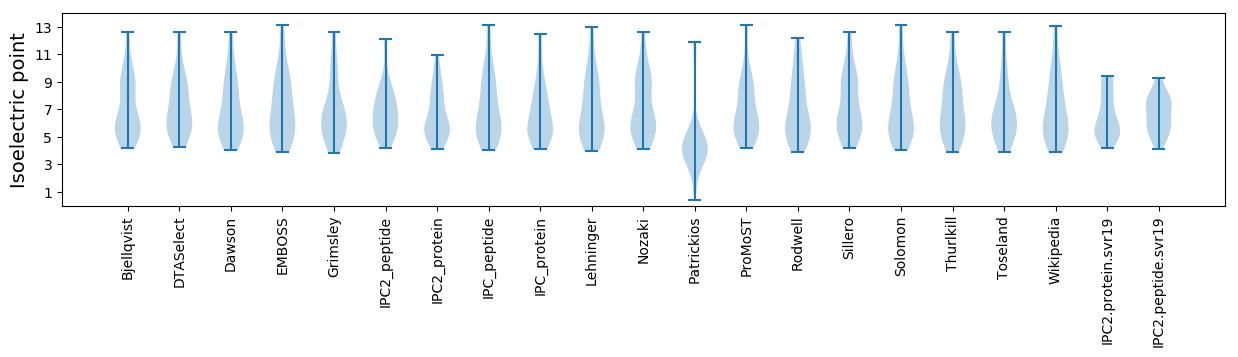
* You can choose from 21 different methods for calculating isoelectric point
Summary statistics related to proteome-wise predictions
Protein with the lowest isoelectric point:
>tr|A0A161DYT5|A0A161DYT5_9ADEN E4 ORF3 OS=Bat mastadenovirus WIV11 OX=1788433 PE=4 SV=1
MM1 pKa = 7.44KK2 pKa = 10.21KK3 pKa = 9.68IEE5 pKa = 4.43LVLDD9 pKa = 4.15DD10 pKa = 4.96SVLNLADD17 pKa = 3.46VLLGQDD23 pKa = 3.7HH24 pKa = 7.15PEE26 pKa = 4.17EE27 pKa = 4.52EE28 pKa = 4.31PQEE31 pKa = 3.96LSIFSGEE38 pKa = 4.42DD39 pKa = 3.24PPTLHH44 pKa = 7.55DD45 pKa = 4.74LFDD48 pKa = 3.78VVLGGDD54 pKa = 3.82HH55 pKa = 7.63PDD57 pKa = 3.47YY58 pKa = 11.44SPDD61 pKa = 3.29VNLIFPTAEE70 pKa = 3.93LEE72 pKa = 4.06QAEE75 pKa = 4.4AEE77 pKa = 4.21NEE79 pKa = 4.11EE80 pKa = 4.35EE81 pKa = 4.42EE82 pKa = 4.73VRR84 pKa = 11.84CEE86 pKa = 4.18TPVVQVDD93 pKa = 4.12LEE95 pKa = 4.66CNEE98 pKa = 4.27SMISTTPEE106 pKa = 3.82GSVGSPEE113 pKa = 3.92RR114 pKa = 11.84EE115 pKa = 3.95EE116 pKa = 4.58PEE118 pKa = 4.22EE119 pKa = 4.66GPSSRR124 pKa = 11.84WGPLEE129 pKa = 4.73PGDD132 pKa = 4.25SPRR135 pKa = 11.84PCRR138 pKa = 11.84DD139 pKa = 3.06CTYY142 pKa = 10.79HH143 pKa = 7.25RR144 pKa = 11.84VEE146 pKa = 5.27SGDD149 pKa = 3.79PSLKK153 pKa = 10.62CGLCYY158 pKa = 10.27MKK160 pKa = 9.96DD161 pKa = 2.87TYY163 pKa = 10.49YY164 pKa = 10.67QVYY167 pKa = 10.29SPVSPATPLTTEE179 pKa = 3.91EE180 pKa = 4.99DD181 pKa = 4.18VVNDD185 pKa = 3.39QPEE188 pKa = 4.33EE189 pKa = 4.32VVTSAPSSPVAEE201 pKa = 4.19EE202 pKa = 3.81TGRR205 pKa = 11.84GARR208 pKa = 11.84RR209 pKa = 11.84RR210 pKa = 11.84PAEE213 pKa = 3.75AAEE216 pKa = 4.35PLDD219 pKa = 3.7LSLPKK224 pKa = 9.94RR225 pKa = 11.84RR226 pKa = 11.84RR227 pKa = 11.84QQQ229 pKa = 2.85
MM1 pKa = 7.44KK2 pKa = 10.21KK3 pKa = 9.68IEE5 pKa = 4.43LVLDD9 pKa = 4.15DD10 pKa = 4.96SVLNLADD17 pKa = 3.46VLLGQDD23 pKa = 3.7HH24 pKa = 7.15PEE26 pKa = 4.17EE27 pKa = 4.52EE28 pKa = 4.31PQEE31 pKa = 3.96LSIFSGEE38 pKa = 4.42DD39 pKa = 3.24PPTLHH44 pKa = 7.55DD45 pKa = 4.74LFDD48 pKa = 3.78VVLGGDD54 pKa = 3.82HH55 pKa = 7.63PDD57 pKa = 3.47YY58 pKa = 11.44SPDD61 pKa = 3.29VNLIFPTAEE70 pKa = 3.93LEE72 pKa = 4.06QAEE75 pKa = 4.4AEE77 pKa = 4.21NEE79 pKa = 4.11EE80 pKa = 4.35EE81 pKa = 4.42EE82 pKa = 4.73VRR84 pKa = 11.84CEE86 pKa = 4.18TPVVQVDD93 pKa = 4.12LEE95 pKa = 4.66CNEE98 pKa = 4.27SMISTTPEE106 pKa = 3.82GSVGSPEE113 pKa = 3.92RR114 pKa = 11.84EE115 pKa = 3.95EE116 pKa = 4.58PEE118 pKa = 4.22EE119 pKa = 4.66GPSSRR124 pKa = 11.84WGPLEE129 pKa = 4.73PGDD132 pKa = 4.25SPRR135 pKa = 11.84PCRR138 pKa = 11.84DD139 pKa = 3.06CTYY142 pKa = 10.79HH143 pKa = 7.25RR144 pKa = 11.84VEE146 pKa = 5.27SGDD149 pKa = 3.79PSLKK153 pKa = 10.62CGLCYY158 pKa = 10.27MKK160 pKa = 9.96DD161 pKa = 2.87TYY163 pKa = 10.49YY164 pKa = 10.67QVYY167 pKa = 10.29SPVSPATPLTTEE179 pKa = 3.91EE180 pKa = 4.99DD181 pKa = 4.18VVNDD185 pKa = 3.39QPEE188 pKa = 4.33EE189 pKa = 4.32VVTSAPSSPVAEE201 pKa = 4.19EE202 pKa = 3.81TGRR205 pKa = 11.84GARR208 pKa = 11.84RR209 pKa = 11.84RR210 pKa = 11.84PAEE213 pKa = 3.75AAEE216 pKa = 4.35PLDD219 pKa = 3.7LSLPKK224 pKa = 9.94RR225 pKa = 11.84RR226 pKa = 11.84RR227 pKa = 11.84QQQ229 pKa = 2.85
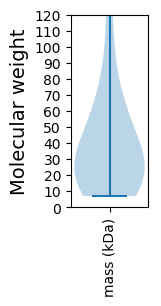
Molecular weight: 25.3 kDa
Isoelectric point according different methods:
Protein with the highest isoelectric point:
>tr|A0A163HKY0|A0A163HKY0_9ADEN Hexon protein OS=Bat mastadenovirus WIV11 OX=1788433 GN=L3 PE=2 SV=1
MM1 pKa = 7.83AKK3 pKa = 10.26RR4 pKa = 11.84MVCRR8 pKa = 11.84VRR10 pKa = 11.84VPIRR14 pKa = 11.84TASVRR19 pKa = 11.84RR20 pKa = 11.84RR21 pKa = 11.84RR22 pKa = 11.84RR23 pKa = 11.84VRR25 pKa = 11.84RR26 pKa = 11.84RR27 pKa = 11.84RR28 pKa = 11.84AGTIASCYY36 pKa = 9.27SACQRR41 pKa = 11.84RR42 pKa = 11.84FGVTGKK48 pKa = 10.05RR49 pKa = 11.84SRR51 pKa = 11.84RR52 pKa = 11.84GRR54 pKa = 11.84RR55 pKa = 11.84RR56 pKa = 11.84RR57 pKa = 11.84GRR59 pKa = 11.84RR60 pKa = 11.84IRR62 pKa = 11.84GGFLPALVPIIAAAIGAIPGIAGVAIQASQRR93 pKa = 11.84HH94 pKa = 4.76
MM1 pKa = 7.83AKK3 pKa = 10.26RR4 pKa = 11.84MVCRR8 pKa = 11.84VRR10 pKa = 11.84VPIRR14 pKa = 11.84TASVRR19 pKa = 11.84RR20 pKa = 11.84RR21 pKa = 11.84RR22 pKa = 11.84RR23 pKa = 11.84VRR25 pKa = 11.84RR26 pKa = 11.84RR27 pKa = 11.84RR28 pKa = 11.84AGTIASCYY36 pKa = 9.27SACQRR41 pKa = 11.84RR42 pKa = 11.84FGVTGKK48 pKa = 10.05RR49 pKa = 11.84SRR51 pKa = 11.84RR52 pKa = 11.84GRR54 pKa = 11.84RR55 pKa = 11.84RR56 pKa = 11.84RR57 pKa = 11.84GRR59 pKa = 11.84RR60 pKa = 11.84IRR62 pKa = 11.84GGFLPALVPIIAAAIGAIPGIAGVAIQASQRR93 pKa = 11.84HH94 pKa = 4.76
Molecular weight: 10.55 kDa
Isoelectric point according different methods:
Peptides (in silico digests for buttom-up proteomics)
Below you can find in silico digests of the whole proteome with Trypsin, Chymotrypsin, Trypsin+LysC, LysN, ArgC proteases suitable for different mass spec machines.| Try ESI |
 |
|---|
| ChTry ESI |
|
|---|
| ArgC ESI |
|
|---|
| LysN ESI |
|
|---|
| TryLysC ESI |
|
|---|
| Try MALDI |
|
|---|
| ChTry MALDI |
|
|---|
| ArgC MALDI |
|
|---|
| LysN MALDI |
|
|---|
| TryLysC MALDI |
|
|---|
| Try LTQ |
|
|---|
| ChTry LTQ |
|
|---|
| ArgC LTQ |
|
|---|
| LysN LTQ |
|
|---|
| TryLysC LTQ |
|
|---|
| Try MSlow |
|
|---|
| ChTry MSlow |
|
|---|
| ArgC MSlow |
|
|---|
| LysN MSlow |
|
|---|
| TryLysC MSlow |
|
|---|
| Try MShigh |
|
|---|
| ChTry MShigh |
|
|---|
| ArgC MShigh |
|
|---|
| LysN MShigh |
|
|---|
| TryLysC MShigh |
|
|---|
General Statistics
Number of major isoforms |
Number of additional isoforms |
Number of all proteins |
Number of amino acids |
Min. Seq. Length |
Max. Seq. Length |
Avg. Seq. Length |
Avg. Mol. Weight |
|---|---|---|---|---|---|---|---|
12668 |
58 |
1648 |
383.9 |
43.06 |
Amino acid frequency
Ala |
Cys |
Asp |
Glu |
Phe |
Gly |
His |
Ile |
Lys |
Leu |
|---|---|---|---|---|---|---|---|---|---|
7.815 ± 0.479 | 1.926 ± 0.27 |
4.721 ± 0.24 | 6.228 ± 0.538 |
3.9 ± 0.279 | 6.252 ± 0.447 |
2.25 ± 0.173 | 4.113 ± 0.349 |
4.16 ± 0.442 | 9.591 ± 0.48 |
Met |
Asn |
Gln |
Pro |
Arg |
Ser |
Thr |
Val |
Trp |
Tyr |
|---|---|---|---|---|---|---|---|---|---|
2.029 ± 0.147 | 4.705 ± 0.454 |
6.434 ± 0.395 | 4.61 ± 0.278 |
6.876 ± 0.687 | 7.302 ± 0.315 |
5.565 ± 0.27 | 6.481 ± 0.314 |
1.366 ± 0.171 | 3.679 ± 0.255 |
Most of the basic statistics you can see at this page can be downloaded from this CSV file
See this proteome in:

Proteome-pI is available under Creative Commons Attribution-NoDerivs license, for more details see here
| Reference: Kozlowski LP. Proteome-pI 2.0: Proteome Isoelectric Point Database Update. Nucleic Acids Res. 2021, doi: 10.1093/nar/gkab944 | Contact: Lukasz P. Kozlowski |