Aeromonas phage 4_L372X
Taxonomy: Viruses; Duplodnaviria; Heunggongvirae; Uroviricota; Caudoviricetes; Caudovirales; Siphoviridae; unclassified Siphoviridae
Average proteome isoelectric point is 6.27
Get precalculated fractions of proteins
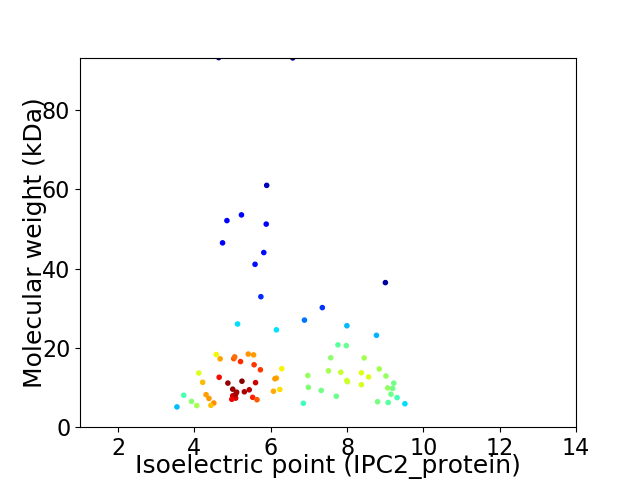
Virtual 2D-PAGE plot for 82 proteins (isoelectric point calculated using IPC2_protein)
Get csv file with sequences according to given criteria:
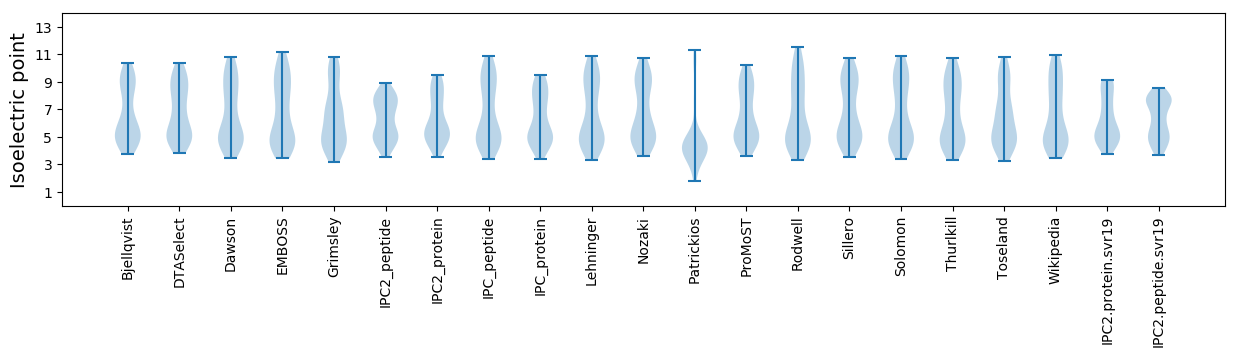
* You can choose from 21 different methods for calculating isoelectric point
Summary statistics related to proteome-wise predictions
Protein with the lowest isoelectric point:
>tr|A0A5J6U3C6|A0A5J6U3C6_9CAUD Uncharacterized protein OS=Aeromonas phage 4_L372X OX=2588519 GN=4L372X_020 PE=4 SV=1
MM1 pKa = 7.79SDD3 pKa = 3.77HH4 pKa = 6.7EE5 pKa = 4.37MSDD8 pKa = 3.49VYY10 pKa = 10.9QAVSNCINTCADD22 pKa = 3.39WPDD25 pKa = 3.44MEE27 pKa = 4.79IAGHH31 pKa = 5.99CVVEE35 pKa = 4.22MLTALGFDD43 pKa = 4.35DD44 pKa = 5.86DD45 pKa = 5.59AIIDD49 pKa = 4.0ALQVASGQSKK59 pKa = 9.77EE60 pKa = 3.93ADD62 pKa = 3.45DD63 pKa = 6.49FIDD66 pKa = 4.42EE67 pKa = 4.28MIARR71 pKa = 11.84IKK73 pKa = 10.54GG74 pKa = 3.35
MM1 pKa = 7.79SDD3 pKa = 3.77HH4 pKa = 6.7EE5 pKa = 4.37MSDD8 pKa = 3.49VYY10 pKa = 10.9QAVSNCINTCADD22 pKa = 3.39WPDD25 pKa = 3.44MEE27 pKa = 4.79IAGHH31 pKa = 5.99CVVEE35 pKa = 4.22MLTALGFDD43 pKa = 4.35DD44 pKa = 5.86DD45 pKa = 5.59AIIDD49 pKa = 4.0ALQVASGQSKK59 pKa = 9.77EE60 pKa = 3.93ADD62 pKa = 3.45DD63 pKa = 6.49FIDD66 pKa = 4.42EE67 pKa = 4.28MIARR71 pKa = 11.84IKK73 pKa = 10.54GG74 pKa = 3.35
Molecular weight: 8.07 kDa
Isoelectric point according different methods:
Protein with the highest isoelectric point:
>tr|A0A5J6U3C1|A0A5J6U3C1_9CAUD Uncharacterized protein OS=Aeromonas phage 4_L372X OX=2588519 GN=4L372X_010 PE=4 SV=1
MM1 pKa = 7.45SKK3 pKa = 10.46SFALIADD10 pKa = 3.74IKK12 pKa = 9.91MRR14 pKa = 11.84WFAKK18 pKa = 10.21PILFALLLVKK28 pKa = 10.43LSPPTWLVKK37 pKa = 10.34RR38 pKa = 11.84LFSIKK43 pKa = 9.9VRR45 pKa = 11.84SDD47 pKa = 3.18EE48 pKa = 4.3KK49 pKa = 11.19SCC51 pKa = 4.54
MM1 pKa = 7.45SKK3 pKa = 10.46SFALIADD10 pKa = 3.74IKK12 pKa = 9.91MRR14 pKa = 11.84WFAKK18 pKa = 10.21PILFALLLVKK28 pKa = 10.43LSPPTWLVKK37 pKa = 10.34RR38 pKa = 11.84LFSIKK43 pKa = 9.9VRR45 pKa = 11.84SDD47 pKa = 3.18EE48 pKa = 4.3KK49 pKa = 11.19SCC51 pKa = 4.54
Molecular weight: 5.92 kDa
Isoelectric point according different methods:
Peptides (in silico digests for buttom-up proteomics)
Below you can find in silico digests of the whole proteome with Trypsin, Chymotrypsin, Trypsin+LysC, LysN, ArgC proteases suitable for different mass spec machines.| Try ESI |
 |
|---|
| ChTry ESI |
|
|---|
| ArgC ESI |
|
|---|
| LysN ESI |
|
|---|
| TryLysC ESI |
|
|---|
| Try MALDI |
|
|---|
| ChTry MALDI |
|
|---|
| ArgC MALDI |
|
|---|
| LysN MALDI |
|
|---|
| TryLysC MALDI |
|
|---|
| Try LTQ |
|
|---|
| ChTry LTQ |
|
|---|
| ArgC LTQ |
|
|---|
| LysN LTQ |
|
|---|
| TryLysC LTQ |
|
|---|
| Try MSlow |
|
|---|
| ChTry MSlow |
|
|---|
| ArgC MSlow |
|
|---|
| LysN MSlow |
|
|---|
| TryLysC MSlow |
|
|---|
| Try MShigh |
|
|---|
| ChTry MShigh |
|
|---|
| ArgC MShigh |
|
|---|
| LysN MShigh |
|
|---|
| TryLysC MShigh |
|
|---|
General Statistics
Number of major isoforms |
Number of additional isoforms |
Number of all proteins |
Number of amino acids |
Min. Seq. Length |
Max. Seq. Length |
Avg. Seq. Length |
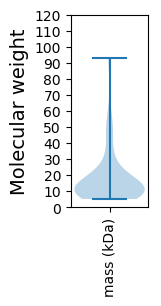
Avg. Mol. Weight |
|---|---|---|---|---|---|---|---|
0 |
13397 |
47 |
892 |
163.4 |
18.18 |
Amino acid frequency
Ala |
Cys |
Asp |
Glu |
Phe |
Gly |
His |
Ile |
Lys |
Leu |
|---|---|---|---|---|---|---|---|---|---|
9.719 ± 0.583 | 1.418 ± 0.169 |
5.874 ± 0.209 | 7.061 ± 0.333 |
3.538 ± 0.201 | 7.173 ± 0.268 |
1.724 ± 0.209 | 6.121 ± 0.222 |
6.337 ± 0.307 | 7.128 ± 0.274 |
Met |
Asn |
Gln |
Pro |
Arg |
Ser |
Thr |
Val |
Trp |
Tyr |
|---|---|---|---|---|---|---|---|---|---|
3.292 ± 0.254 | 4.105 ± 0.201 |
3.254 ± 0.203 | 4.09 ± 0.273 |
5.27 ± 0.279 | 6.77 ± 0.312 |
5.322 ± 0.342 | 6.852 ± 0.241 |
1.485 ± 0.122 | 3.456 ± 0.209 |
Most of the basic statistics you can see at this page can be downloaded from this CSV file
See this proteome in:

Proteome-pI is available under Creative Commons Attribution-NoDerivs license, for more details see here
| Reference: Kozlowski LP. Proteome-pI 2.0: Proteome Isoelectric Point Database Update. Nucleic Acids Res. 2021, doi: 10.1093/nar/gkab944 | Contact: Lukasz P. Kozlowski |