Aquabacterium commune
Taxonomy: cellular organisms; Bacteria; Proteobacteria; Betaproteobacteria; Burkholderiales; Burkholderiales genera incertae sedis; Aquabacterium
Average proteome isoelectric point is 6.9
Get precalculated fractions of proteins
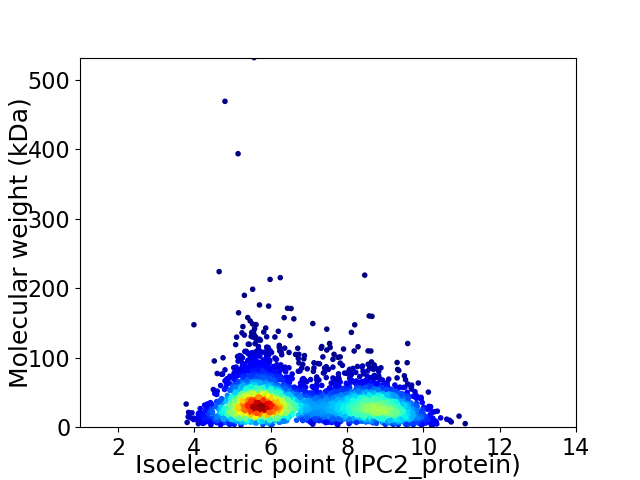
Virtual 2D-PAGE plot for 3649 proteins (isoelectric point calculated using IPC2_protein)
Get csv file with sequences according to given criteria:
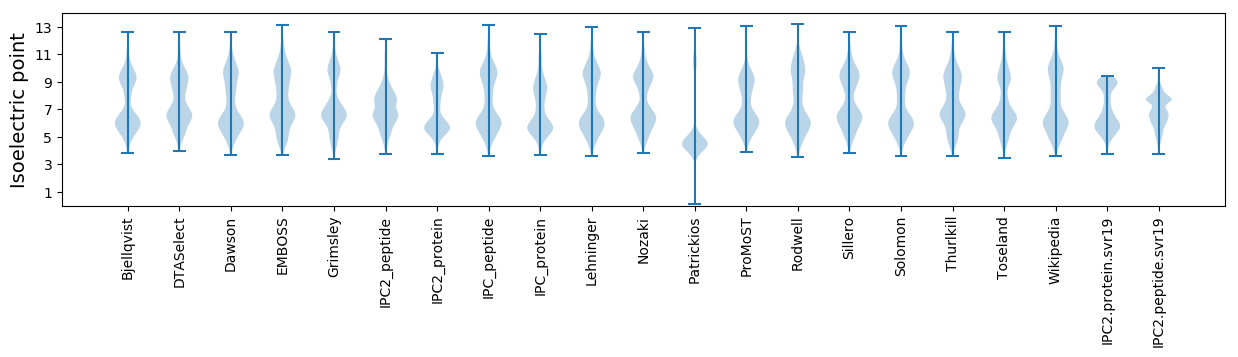
* You can choose from 21 different methods for calculating isoelectric point
Summary statistics related to proteome-wise predictions
Protein with the lowest isoelectric point:
>tr|A0A4R6RPX5|A0A4R6RPX5_9BURK Diguanylate cyclase (GGDEF)-like protein OS=Aquabacterium commune OX=70586 GN=EV672_101332 PE=4 SV=1
MM1 pKa = 7.28NPSDD5 pKa = 4.58VSDD8 pKa = 4.11LSTWMCLICGWIYY21 pKa = 11.22DD22 pKa = 4.06EE23 pKa = 5.24AAGLPEE29 pKa = 4.46EE30 pKa = 5.49GIAPGTRR37 pKa = 11.84WADD40 pKa = 3.22VPMNWVCPEE49 pKa = 3.74CGARR53 pKa = 11.84KK54 pKa = 9.81DD55 pKa = 3.83DD56 pKa = 4.18FEE58 pKa = 4.39MVPVV62 pKa = 3.92
MM1 pKa = 7.28NPSDD5 pKa = 4.58VSDD8 pKa = 4.11LSTWMCLICGWIYY21 pKa = 11.22DD22 pKa = 4.06EE23 pKa = 5.24AAGLPEE29 pKa = 4.46EE30 pKa = 5.49GIAPGTRR37 pKa = 11.84WADD40 pKa = 3.22VPMNWVCPEE49 pKa = 3.74CGARR53 pKa = 11.84KK54 pKa = 9.81DD55 pKa = 3.83DD56 pKa = 4.18FEE58 pKa = 4.39MVPVV62 pKa = 3.92
Molecular weight: 6.88 kDa
Isoelectric point according different methods:
Protein with the highest isoelectric point:
>tr|A0A4R6RAD6|A0A4R6RAD6_9BURK Putative secreted hydrolase OS=Aquabacterium commune OX=70586 GN=EV672_105166 PE=4 SV=1
MM1 pKa = 7.35KK2 pKa = 9.43RR3 pKa = 11.84TYY5 pKa = 10.25QPSKK9 pKa = 7.79TRR11 pKa = 11.84RR12 pKa = 11.84ARR14 pKa = 11.84THH16 pKa = 5.79GFLVRR21 pKa = 11.84MKK23 pKa = 9.67TKK25 pKa = 10.38GGRR28 pKa = 11.84KK29 pKa = 9.05VISARR34 pKa = 11.84RR35 pKa = 11.84AKK37 pKa = 9.85GRR39 pKa = 11.84KK40 pKa = 9.07RR41 pKa = 11.84LGLL44 pKa = 3.7
MM1 pKa = 7.35KK2 pKa = 9.43RR3 pKa = 11.84TYY5 pKa = 10.25QPSKK9 pKa = 7.79TRR11 pKa = 11.84RR12 pKa = 11.84ARR14 pKa = 11.84THH16 pKa = 5.79GFLVRR21 pKa = 11.84MKK23 pKa = 9.67TKK25 pKa = 10.38GGRR28 pKa = 11.84KK29 pKa = 9.05VISARR34 pKa = 11.84RR35 pKa = 11.84AKK37 pKa = 9.85GRR39 pKa = 11.84KK40 pKa = 9.07RR41 pKa = 11.84LGLL44 pKa = 3.7
Molecular weight: 5.14 kDa
Isoelectric point according different methods:
Peptides (in silico digests for buttom-up proteomics)
Below you can find in silico digests of the whole proteome with Trypsin, Chymotrypsin, Trypsin+LysC, LysN, ArgC proteases suitable for different mass spec machines.| Try ESI |
 |
|---|
| ChTry ESI |
|
|---|
| ArgC ESI |
|
|---|
| LysN ESI |
|
|---|
| TryLysC ESI |
|
|---|
| Try MALDI |
|
|---|
| ChTry MALDI |
|
|---|
| ArgC MALDI |
|
|---|
| LysN MALDI |
|
|---|
| TryLysC MALDI |
|
|---|
| Try LTQ |
|
|---|
| ChTry LTQ |
|
|---|
| ArgC LTQ |
|
|---|
| LysN LTQ |
|
|---|
| TryLysC LTQ |
|
|---|
| Try MSlow |
|
|---|
| ChTry MSlow |
|
|---|
| ArgC MSlow |
|
|---|
| LysN MSlow |
|
|---|
| TryLysC MSlow |
|
|---|
| Try MShigh |
|
|---|
| ChTry MShigh |
|
|---|
| ArgC MShigh |
|
|---|
| LysN MShigh |
|
|---|
| TryLysC MShigh |
|
|---|
General Statistics
Number of major isoforms |
Number of additional isoforms |
Number of all proteins |
Number of amino acids |
Min. Seq. Length |
Max. Seq. Length |
Avg. Seq. Length |
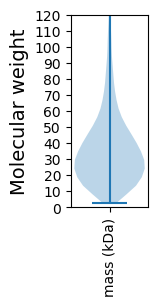
Avg. Mol. Weight |
|---|---|---|---|---|---|---|---|
0 |
1271893 |
25 |
4944 |
348.6 |
37.81 |
Amino acid frequency
Ala |
Cys |
Asp |
Glu |
Phe |
Gly |
His |
Ile |
Lys |
Leu |
|---|---|---|---|---|---|---|---|---|---|
12.802 ± 0.059 | 0.914 ± 0.014 |
5.404 ± 0.029 | 5.082 ± 0.04 |
3.274 ± 0.026 | 8.122 ± 0.043 |
2.524 ± 0.027 | 3.963 ± 0.029 |
3.242 ± 0.036 | 10.807 ± 0.047 |
Met |
Asn |
Gln |
Pro |
Arg |
Ser |
Thr |
Val |
Trp |
Tyr |
|---|---|---|---|---|---|---|---|---|---|
2.43 ± 0.022 | 2.532 ± 0.027 |
5.323 ± 0.035 | 4.551 ± 0.03 |
6.89 ± 0.041 | 5.577 ± 0.031 |
5.377 ± 0.034 | 7.698 ± 0.032 |
1.549 ± 0.02 | 1.938 ± 0.024 |
Most of the basic statistics you can see at this page can be downloaded from this CSV file
See this proteome in:

Proteome-pI is available under Creative Commons Attribution-NoDerivs license, for more details see here
| Reference: Kozlowski LP. Proteome-pI 2.0: Proteome Isoelectric Point Database Update. Nucleic Acids Res. 2021, doi: 10.1093/nar/gkab944 | Contact: Lukasz P. Kozlowski |