Pseudomonas phage MR2
Taxonomy: Viruses; Duplodnaviria; Heunggongvirae; Uroviricota; Caudoviricetes; Caudovirales; Autographiviridae; Studiervirinae; Ghunavirus; unclassified Ghunavirus
Average proteome isoelectric point is 6.49
Get precalculated fractions of proteins
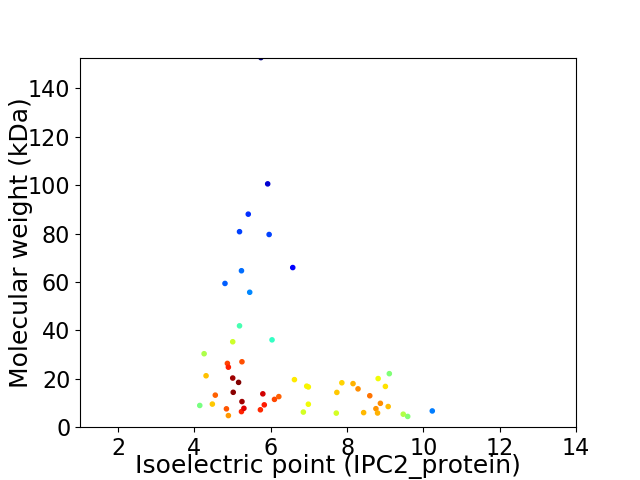
Virtual 2D-PAGE plot for 55 proteins (isoelectric point calculated using IPC2_protein)
Get csv file with sequences according to given criteria:
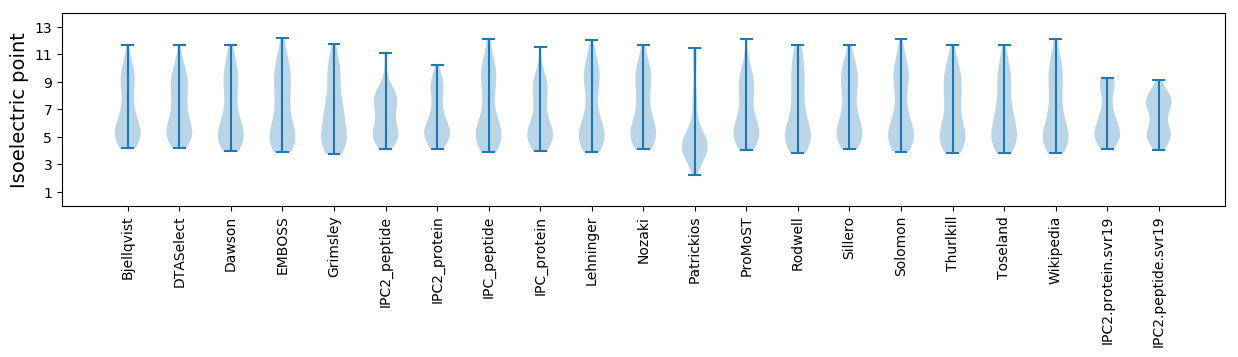
* You can choose from 21 different methods for calculating isoelectric point
Summary statistics related to proteome-wise predictions
Protein with the lowest isoelectric point:
>tr|A0A6M3T8T9|A0A6M3T8T9_9CAUD DNA ligase OS=Pseudomonas phage MR2 OX=2711170 GN=PssvBMR2_gp15 PE=4 SV=1
MM1 pKa = 7.26LAIVQHH7 pKa = 6.18YY8 pKa = 8.65IQNPDD13 pKa = 4.95DD14 pKa = 4.38IPDD17 pKa = 3.65IAQASAEE24 pKa = 4.06YY25 pKa = 11.14LNVRR29 pKa = 11.84LNASYY34 pKa = 10.89LIATGMVDD42 pKa = 3.28EE43 pKa = 4.95LRR45 pKa = 11.84RR46 pKa = 11.84SGMSEE51 pKa = 3.58QFIAGFLEE59 pKa = 4.56GCNAATEE66 pKa = 4.68IIEE69 pKa = 4.9LMQEE73 pKa = 4.07SQRR76 pKa = 11.84QQEE79 pKa = 4.35DD80 pKa = 3.11
MM1 pKa = 7.26LAIVQHH7 pKa = 6.18YY8 pKa = 8.65IQNPDD13 pKa = 4.95DD14 pKa = 4.38IPDD17 pKa = 3.65IAQASAEE24 pKa = 4.06YY25 pKa = 11.14LNVRR29 pKa = 11.84LNASYY34 pKa = 10.89LIATGMVDD42 pKa = 3.28EE43 pKa = 4.95LRR45 pKa = 11.84RR46 pKa = 11.84SGMSEE51 pKa = 3.58QFIAGFLEE59 pKa = 4.56GCNAATEE66 pKa = 4.68IIEE69 pKa = 4.9LMQEE73 pKa = 4.07SQRR76 pKa = 11.84QQEE79 pKa = 4.35DD80 pKa = 3.11
Molecular weight: 8.98 kDa
Isoelectric point according different methods:
Protein with the highest isoelectric point:
>tr|A0A6M3TCK3|A0A6M3TCK3_9CAUD Putative DNA-directed RNA polymerase OS=Pseudomonas phage MR2 OX=2711170 GN=PssvBMR2_gp12 PE=4 SV=1
MM1 pKa = 7.15TRR3 pKa = 11.84QGGPKK8 pKa = 10.07DD9 pKa = 3.58RR10 pKa = 11.84VKK12 pKa = 11.02EE13 pKa = 3.97GLDD16 pKa = 3.23KK17 pKa = 10.99VVKK20 pKa = 9.89RR21 pKa = 11.84CRR23 pKa = 11.84IRR25 pKa = 11.84NINNEE30 pKa = 4.15TRR32 pKa = 11.84CQRR35 pKa = 11.84WTT37 pKa = 3.25
MM1 pKa = 7.15TRR3 pKa = 11.84QGGPKK8 pKa = 10.07DD9 pKa = 3.58RR10 pKa = 11.84VKK12 pKa = 11.02EE13 pKa = 3.97GLDD16 pKa = 3.23KK17 pKa = 10.99VVKK20 pKa = 9.89RR21 pKa = 11.84CRR23 pKa = 11.84IRR25 pKa = 11.84NINNEE30 pKa = 4.15TRR32 pKa = 11.84CQRR35 pKa = 11.84WTT37 pKa = 3.25
Molecular weight: 4.44 kDa
Isoelectric point according different methods:
Peptides (in silico digests for buttom-up proteomics)
Below you can find in silico digests of the whole proteome with Trypsin, Chymotrypsin, Trypsin+LysC, LysN, ArgC proteases suitable for different mass spec machines.| Try ESI |
 |
|---|
| ChTry ESI |
|
|---|
| ArgC ESI |
|
|---|
| LysN ESI |
|
|---|
| TryLysC ESI |
|
|---|
| Try MALDI |
|
|---|
| ChTry MALDI |
|
|---|
| ArgC MALDI |
|
|---|
| LysN MALDI |
|
|---|
| TryLysC MALDI |
|
|---|
| Try LTQ |
|
|---|
| ChTry LTQ |
|
|---|
| ArgC LTQ |
|
|---|
| LysN LTQ |
|
|---|
| TryLysC LTQ |
|
|---|
| Try MSlow |
|
|---|
| ChTry MSlow |
|
|---|
| ArgC MSlow |
|
|---|
| LysN MSlow |
|
|---|
| TryLysC MSlow |
|
|---|
| Try MShigh |
|
|---|
| ChTry MShigh |
|
|---|
| ArgC MShigh |
|
|---|
| LysN MShigh |
|
|---|
| TryLysC MShigh |
|
|---|
General Statistics
Number of major isoforms |
Number of additional isoforms |
Number of all proteins |
Number of amino acids |
Min. Seq. Length |
Max. Seq. Length |
Avg. Seq. Length |
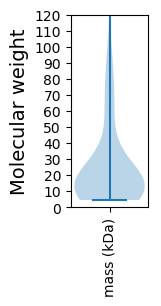
Avg. Mol. Weight |
|---|---|---|---|---|---|---|---|
0 |
12926 |
37 |
1399 |
235.0 |
26.09 |
Amino acid frequency
Ala |
Cys |
Asp |
Glu |
Phe |
Gly |
His |
Ile |
Lys |
Leu |
|---|---|---|---|---|---|---|---|---|---|
9.81 ± 0.471 | 0.874 ± 0.138 |
6.622 ± 0.271 | 6.607 ± 0.471 |
3.644 ± 0.215 | 7.806 ± 0.337 |
2.004 ± 0.211 | 4.905 ± 0.209 |
5.864 ± 0.343 | 8.115 ± 0.27 |
Met |
Asn |
Gln |
Pro |
Arg |
Ser |
Thr |
Val |
Trp |
Tyr |
|---|---|---|---|---|---|---|---|---|---|
2.654 ± 0.173 | 4.054 ± 0.289 |
3.868 ± 0.242 | 4.464 ± 0.325 |
5.934 ± 0.26 | 6.096 ± 0.46 |
5.562 ± 0.297 | 6.537 ± 0.303 |
1.532 ± 0.132 | 3.048 ± 0.159 |
Most of the basic statistics you can see at this page can be downloaded from this CSV file
See this proteome in:

Proteome-pI is available under Creative Commons Attribution-NoDerivs license, for more details see here
| Reference: Kozlowski LP. Proteome-pI 2.0: Proteome Isoelectric Point Database Update. Nucleic Acids Res. 2021, doi: 10.1093/nar/gkab944 | Contact: Lukasz P. Kozlowski |