Simplicispira sp. 125
Taxonomy: cellular organisms; Bacteria; Proteobacteria; Betaproteobacteria; Burkholderiales; Comamonadaceae; Simplicispira; unclassified Simplicispira
Average proteome isoelectric point is 6.89
Get precalculated fractions of proteins
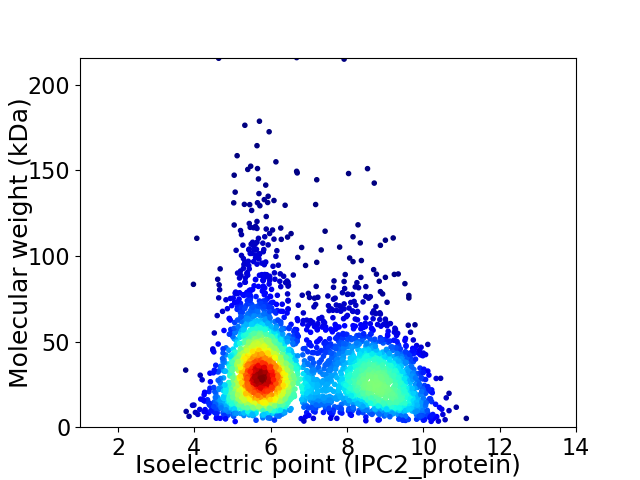
Virtual 2D-PAGE plot for 3567 proteins (isoelectric point calculated using IPC2_protein)
Get csv file with sequences according to given criteria:
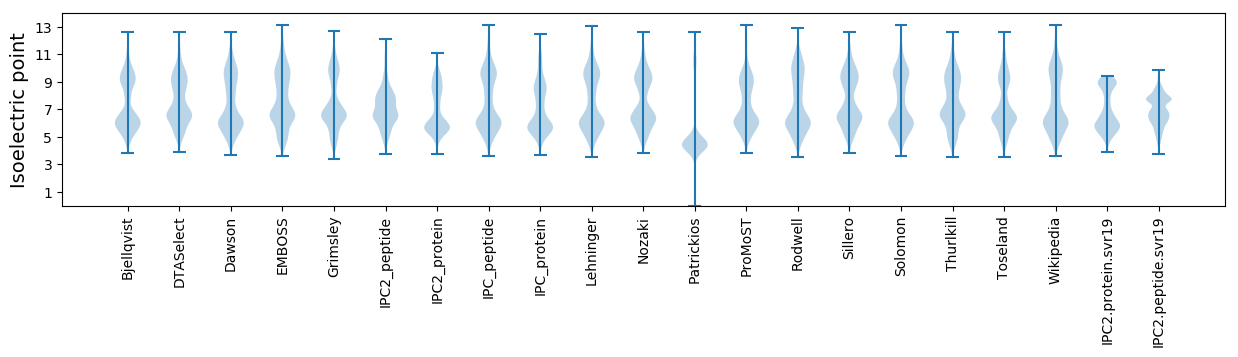
* You can choose from 21 different methods for calculating isoelectric point
Summary statistics related to proteome-wise predictions
Protein with the lowest isoelectric point:
>tr|A0A2U1C253|A0A2U1C253_9BURK 50S ribosomal protein L28 OS=Simplicispira sp. 125 OX=2135643 GN=rpmB PE=3 SV=1
MM1 pKa = 7.63TDD3 pKa = 3.07SLTWMCLLCGWIYY16 pKa = 11.25DD17 pKa = 4.02EE18 pKa = 5.52ARR20 pKa = 11.84GSPEE24 pKa = 3.58YY25 pKa = 10.31GIPPGTPWDD34 pKa = 3.79QVPADD39 pKa = 4.0WTCPEE44 pKa = 4.28CGAGKK49 pKa = 10.12SVFEE53 pKa = 4.25MVQII57 pKa = 4.41
MM1 pKa = 7.63TDD3 pKa = 3.07SLTWMCLLCGWIYY16 pKa = 11.25DD17 pKa = 4.02EE18 pKa = 5.52ARR20 pKa = 11.84GSPEE24 pKa = 3.58YY25 pKa = 10.31GIPPGTPWDD34 pKa = 3.79QVPADD39 pKa = 4.0WTCPEE44 pKa = 4.28CGAGKK49 pKa = 10.12SVFEE53 pKa = 4.25MVQII57 pKa = 4.41
Molecular weight: 6.34 kDa
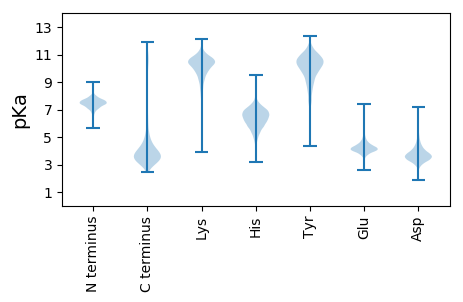
Isoelectric point according different methods:
Protein with the highest isoelectric point:
>tr|A0A2U1C9T2|A0A2U1C9T2_9BURK Formate dehydrogenase gamma subunit OS=Simplicispira sp. 125 OX=2135643 GN=C8D04_2935 PE=3 SV=1
MM1 pKa = 7.35KK2 pKa = 9.43RR3 pKa = 11.84TYY5 pKa = 10.25QPSKK9 pKa = 7.79TRR11 pKa = 11.84RR12 pKa = 11.84ARR14 pKa = 11.84THH16 pKa = 5.79GFLVRR21 pKa = 11.84MKK23 pKa = 9.7TRR25 pKa = 11.84GGRR28 pKa = 11.84AVINARR34 pKa = 11.84RR35 pKa = 11.84AKK37 pKa = 9.58GRR39 pKa = 11.84KK40 pKa = 8.75RR41 pKa = 11.84LAVV44 pKa = 3.41
MM1 pKa = 7.35KK2 pKa = 9.43RR3 pKa = 11.84TYY5 pKa = 10.25QPSKK9 pKa = 7.79TRR11 pKa = 11.84RR12 pKa = 11.84ARR14 pKa = 11.84THH16 pKa = 5.79GFLVRR21 pKa = 11.84MKK23 pKa = 9.7TRR25 pKa = 11.84GGRR28 pKa = 11.84AVINARR34 pKa = 11.84RR35 pKa = 11.84AKK37 pKa = 9.58GRR39 pKa = 11.84KK40 pKa = 8.75RR41 pKa = 11.84LAVV44 pKa = 3.41
Molecular weight: 5.14 kDa
Isoelectric point according different methods:
Peptides (in silico digests for buttom-up proteomics)
Below you can find in silico digests of the whole proteome with Trypsin, Chymotrypsin, Trypsin+LysC, LysN, ArgC proteases suitable for different mass spec machines.| Try ESI |
 |
|---|
| ChTry ESI |
|
|---|
| ArgC ESI |
|
|---|
| LysN ESI |
|
|---|
| TryLysC ESI |
|
|---|
| Try MALDI |
|
|---|
| ChTry MALDI |
|
|---|
| ArgC MALDI |
|
|---|
| LysN MALDI |
|
|---|
| TryLysC MALDI |
|
|---|
| Try LTQ |
|
|---|
| ChTry LTQ |
|
|---|
| ArgC LTQ |
|
|---|
| LysN LTQ |
|
|---|
| TryLysC LTQ |
|
|---|
| Try MSlow |
|
|---|
| ChTry MSlow |
|
|---|
| ArgC MSlow |
|
|---|
| LysN MSlow |
|
|---|
| TryLysC MSlow |
|
|---|
| Try MShigh |
|
|---|
| ChTry MShigh |
|
|---|
| ArgC MShigh |
|
|---|
| LysN MShigh |
|
|---|
| TryLysC MShigh |
|
|---|
General Statistics
Number of major isoforms |
Number of additional isoforms |
Number of all proteins |
Number of amino acids |
Min. Seq. Length |
Max. Seq. Length |
Avg. Seq. Length |
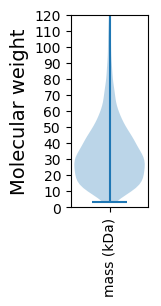
Avg. Mol. Weight |
|---|---|---|---|---|---|---|---|
0 |
1182683 |
30 |
1990 |
331.6 |
35.99 |
Amino acid frequency
Ala |
Cys |
Asp |
Glu |
Phe |
Gly |
His |
Ile |
Lys |
Leu |
|---|---|---|---|---|---|---|---|---|---|
12.825 ± 0.053 | 0.958 ± 0.012 |
5.045 ± 0.028 | 5.147 ± 0.035 |
3.432 ± 0.025 | 8.226 ± 0.036 |
2.403 ± 0.021 | 4.243 ± 0.036 |
3.207 ± 0.04 | 10.912 ± 0.053 |
Met |
Asn |
Gln |
Pro |
Arg |
Ser |
Thr |
Val |
Trp |
Tyr |
|---|---|---|---|---|---|---|---|---|---|
2.613 ± 0.019 | 2.569 ± 0.022 |
5.241 ± 0.033 | 4.569 ± 0.031 |
6.655 ± 0.037 | 5.289 ± 0.029 |
5.308 ± 0.031 | 7.682 ± 0.039 |
1.493 ± 0.017 | 2.183 ± 0.019 |
Most of the basic statistics you can see at this page can be downloaded from this CSV file
See this proteome in:

Proteome-pI is available under Creative Commons Attribution-NoDerivs license, for more details see here
| Reference: Kozlowski LP. Proteome-pI 2.0: Proteome Isoelectric Point Database Update. Nucleic Acids Res. 2021, doi: 10.1093/nar/gkab944 | Contact: Lukasz P. Kozlowski |