Oribacterium sp. oral taxon 078 str. F0262
Taxonomy: cellular organisms; Bacteria; Terrabacteria group; Firmicutes; Clostridia; Eubacteriales; Lachnospiraceae; Oribacterium; unclassified Oribacterium; Oribacterium sp. oral taxon 078
Average proteome isoelectric point is 6.82
Get precalculated fractions of proteins
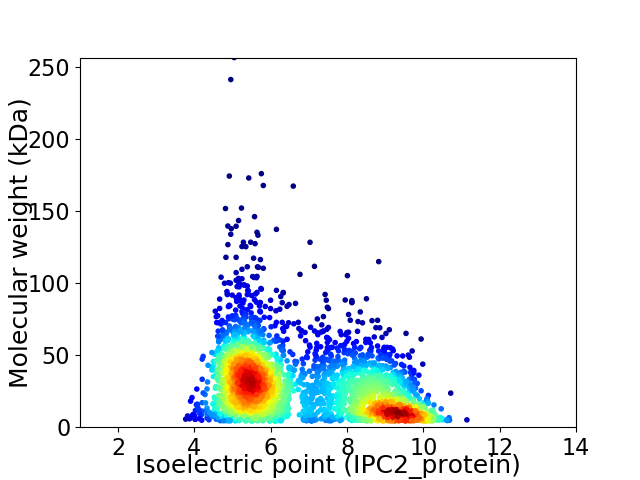
Virtual 2D-PAGE plot for 2936 proteins (isoelectric point calculated using IPC2_protein)
Get csv file with sequences according to given criteria:
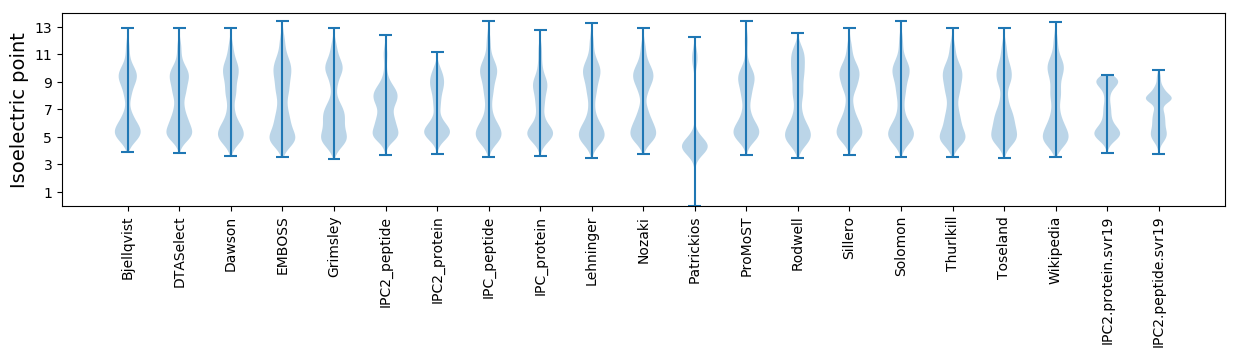
* You can choose from 21 different methods for calculating isoelectric point
Summary statistics related to proteome-wise predictions
Protein with the lowest isoelectric point:
>tr|D4CPC5|D4CPC5_9FIRM Uncharacterized protein OS=Oribacterium sp. oral taxon 078 str. F0262 OX=608534 GN=GCWU000341_02216 PE=4 SV=1
MM1 pKa = 7.59TDD3 pKa = 3.09YY4 pKa = 11.24AALVGLEE11 pKa = 4.31FYY13 pKa = 10.91FLAADD18 pKa = 4.23TEE20 pKa = 4.75PGFSGEE26 pKa = 3.66INAADD31 pKa = 3.86FQKK34 pKa = 9.96TVIDD38 pKa = 4.46LVSFHH43 pKa = 7.28CISVHH48 pKa = 6.92PDD50 pKa = 2.7TT51 pKa = 5.66
MM1 pKa = 7.59TDD3 pKa = 3.09YY4 pKa = 11.24AALVGLEE11 pKa = 4.31FYY13 pKa = 10.91FLAADD18 pKa = 4.23TEE20 pKa = 4.75PGFSGEE26 pKa = 3.66INAADD31 pKa = 3.86FQKK34 pKa = 9.96TVIDD38 pKa = 4.46LVSFHH43 pKa = 7.28CISVHH48 pKa = 6.92PDD50 pKa = 2.7TT51 pKa = 5.66
Molecular weight: 5.57 kDa
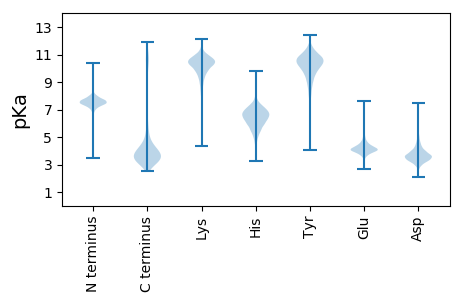
Isoelectric point according different methods:
Protein with the highest isoelectric point:
>tr|D4CN60|D4CN60_9FIRM Uncharacterized protein OS=Oribacterium sp. oral taxon 078 str. F0262 OX=608534 GN=GCWU000341_01800 PE=4 SV=1
MM1 pKa = 7.36HH2 pKa = 7.48LSLGRR7 pKa = 11.84GRR9 pKa = 11.84QNGSAFFRR17 pKa = 11.84TRR19 pKa = 11.84GGRR22 pKa = 11.84QSGSASFRR30 pKa = 11.84RR31 pKa = 11.84IKK33 pKa = 10.15KK34 pKa = 9.13GKK36 pKa = 9.86RR37 pKa = 11.84SGGANGLPRR46 pKa = 11.84GGG48 pKa = 3.59
MM1 pKa = 7.36HH2 pKa = 7.48LSLGRR7 pKa = 11.84GRR9 pKa = 11.84QNGSAFFRR17 pKa = 11.84TRR19 pKa = 11.84GGRR22 pKa = 11.84QSGSASFRR30 pKa = 11.84RR31 pKa = 11.84IKK33 pKa = 10.15KK34 pKa = 9.13GKK36 pKa = 9.86RR37 pKa = 11.84SGGANGLPRR46 pKa = 11.84GGG48 pKa = 3.59
Molecular weight: 5.07 kDa
Isoelectric point according different methods:
Peptides (in silico digests for buttom-up proteomics)
Below you can find in silico digests of the whole proteome with Trypsin, Chymotrypsin, Trypsin+LysC, LysN, ArgC proteases suitable for different mass spec machines.| Try ESI |
 |
|---|
| ChTry ESI |
|
|---|
| ArgC ESI |
|
|---|
| LysN ESI |
|
|---|
| TryLysC ESI |
|
|---|
| Try MALDI |
|
|---|
| ChTry MALDI |
|
|---|
| ArgC MALDI |
|
|---|
| LysN MALDI |
|
|---|
| TryLysC MALDI |
|
|---|
| Try LTQ |
|
|---|
| ChTry LTQ |
|
|---|
| ArgC LTQ |
|
|---|
| LysN LTQ |
|
|---|
| TryLysC LTQ |
|
|---|
| Try MSlow |
|
|---|
| ChTry MSlow |
|
|---|
| ArgC MSlow |
|
|---|
| LysN MSlow |
|
|---|
| TryLysC MSlow |
|
|---|
| Try MShigh |
|
|---|
| ChTry MShigh |
|
|---|
| ArgC MShigh |
|
|---|
| LysN MShigh |
|
|---|
| TryLysC MShigh |
|
|---|
General Statistics
Number of major isoforms |
Number of additional isoforms |
Number of all proteins |
Number of amino acids |
Min. Seq. Length |
Max. Seq. Length |
Avg. Seq. Length |
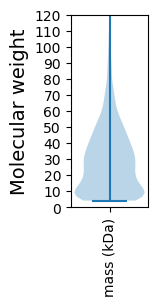
Avg. Mol. Weight |
|---|---|---|---|---|---|---|---|
0 |
809676 |
39 |
2318 |
275.8 |
30.96 |
Amino acid frequency
Ala |
Cys |
Asp |
Glu |
Phe |
Gly |
His |
Ile |
Lys |
Leu |
|---|---|---|---|---|---|---|---|---|---|
7.836 ± 0.049 | 1.424 ± 0.019 |
5.021 ± 0.031 | 8.528 ± 0.068 |
4.343 ± 0.034 | 7.875 ± 0.048 |
1.65 ± 0.02 | 6.295 ± 0.042 |
5.773 ± 0.04 | 10.574 ± 0.06 |
Met |
Asn |
Gln |
Pro |
Arg |
Ser |
Thr |
Val |
Trp |
Tyr |
|---|---|---|---|---|---|---|---|---|---|
2.672 ± 0.023 | 3.186 ± 0.029 |
3.857 ± 0.026 | 2.708 ± 0.026 |
7.159 ± 0.055 | 7.152 ± 0.045 |
4.054 ± 0.033 | 5.419 ± 0.038 |
0.905 ± 0.019 | 3.567 ± 0.03 |
Most of the basic statistics you can see at this page can be downloaded from this CSV file
See this proteome in:

Proteome-pI is available under Creative Commons Attribution-NoDerivs license, for more details see here
| Reference: Kozlowski LP. Proteome-pI 2.0: Proteome Isoelectric Point Database Update. Nucleic Acids Res. 2021, doi: 10.1093/nar/gkab944 | Contact: Lukasz P. Kozlowski |