Synechococcus sp. SynAce01
Taxonomy: cellular organisms; Bacteria; Terrabacteria group; Cyanobacteria/Melainabacteria group; Cyanobacteria; Synechococcales; Synechococcaceae; Synechococcus; unclassified Synechococcus
Average proteome isoelectric point is 6.58
Get precalculated fractions of proteins
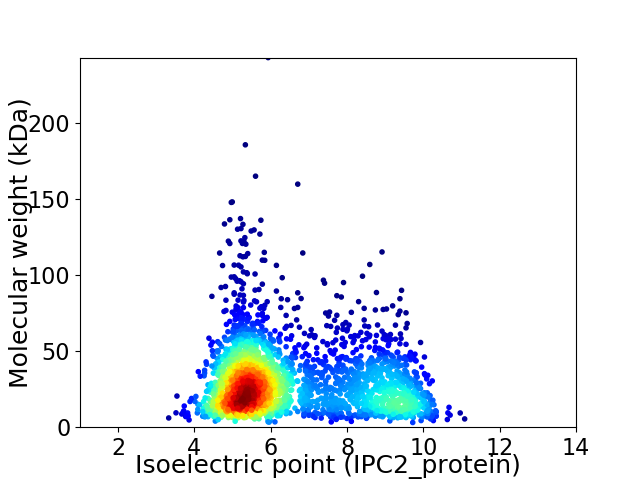
Virtual 2D-PAGE plot for 2626 proteins (isoelectric point calculated using IPC2_protein)
Get csv file with sequences according to given criteria:
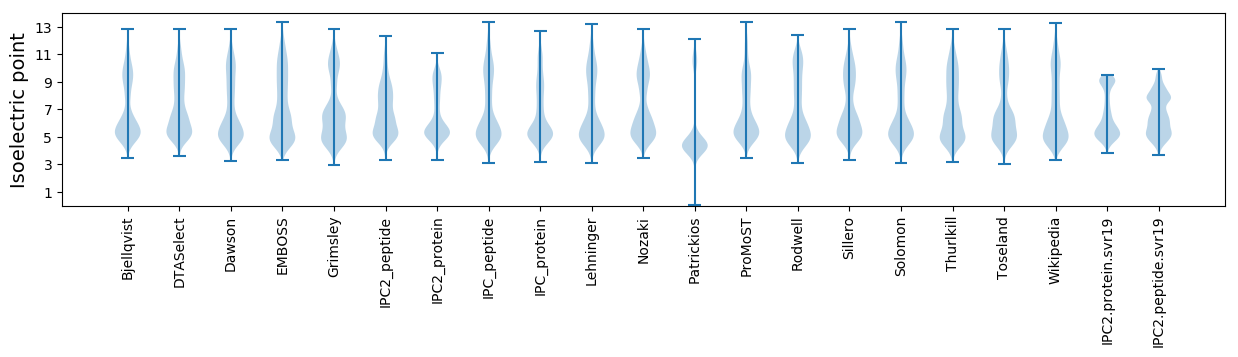
* You can choose from 21 different methods for calculating isoelectric point
Summary statistics related to proteome-wise predictions
Protein with the lowest isoelectric point:
>tr|A0A1J0P7T2|A0A1J0P7T2_9SYNE Plasma-membrane proton-efflux P-type ATPase OS=Synechococcus sp. SynAce01 OX=1916956 GN=BM449_01575 PE=3 SV=1
MM1 pKa = 7.71PAPVPWSLAWSEE13 pKa = 4.2SGEE16 pKa = 4.01LALADD21 pKa = 4.8RR22 pKa = 11.84LDD24 pKa = 4.16LLHH27 pKa = 6.37TLIMSEE33 pKa = 4.51SPDD36 pKa = 3.39IQPTLIASLEE46 pKa = 4.41AISLEE51 pKa = 4.44EE52 pKa = 3.99VSSLCTDD59 pKa = 3.96GLTGTCAA66 pKa = 3.33
MM1 pKa = 7.71PAPVPWSLAWSEE13 pKa = 4.2SGEE16 pKa = 4.01LALADD21 pKa = 4.8RR22 pKa = 11.84LDD24 pKa = 4.16LLHH27 pKa = 6.37TLIMSEE33 pKa = 4.51SPDD36 pKa = 3.39IQPTLIASLEE46 pKa = 4.41AISLEE51 pKa = 4.44EE52 pKa = 3.99VSSLCTDD59 pKa = 3.96GLTGTCAA66 pKa = 3.33
Molecular weight: 6.97 kDa
Isoelectric point according different methods:
Protein with the highest isoelectric point:
>tr|A0A1J0P8C8|A0A1J0P8C8_9SYNE Peptidase M23 OS=Synechococcus sp. SynAce01 OX=1916956 GN=BM449_02945 PE=4 SV=1
MM1 pKa = 7.56TKK3 pKa = 9.03RR4 pKa = 11.84TLEE7 pKa = 3.92GTSRR11 pKa = 11.84KK12 pKa = 9.24RR13 pKa = 11.84KK14 pKa = 7.95RR15 pKa = 11.84VSGFRR20 pKa = 11.84VRR22 pKa = 11.84MRR24 pKa = 11.84SHH26 pKa = 6.21TGRR29 pKa = 11.84RR30 pKa = 11.84VIRR33 pKa = 11.84TRR35 pKa = 11.84RR36 pKa = 11.84RR37 pKa = 11.84RR38 pKa = 11.84GRR40 pKa = 11.84ARR42 pKa = 11.84LAVV45 pKa = 3.5
MM1 pKa = 7.56TKK3 pKa = 9.03RR4 pKa = 11.84TLEE7 pKa = 3.92GTSRR11 pKa = 11.84KK12 pKa = 9.24RR13 pKa = 11.84KK14 pKa = 7.95RR15 pKa = 11.84VSGFRR20 pKa = 11.84VRR22 pKa = 11.84MRR24 pKa = 11.84SHH26 pKa = 6.21TGRR29 pKa = 11.84RR30 pKa = 11.84VIRR33 pKa = 11.84TRR35 pKa = 11.84RR36 pKa = 11.84RR37 pKa = 11.84RR38 pKa = 11.84GRR40 pKa = 11.84ARR42 pKa = 11.84LAVV45 pKa = 3.5
Molecular weight: 5.45 kDa
Isoelectric point according different methods:
Peptides (in silico digests for buttom-up proteomics)
Below you can find in silico digests of the whole proteome with Trypsin, Chymotrypsin, Trypsin+LysC, LysN, ArgC proteases suitable for different mass spec machines.| Try ESI |
 |
|---|
| ChTry ESI |
|
|---|
| ArgC ESI |
|
|---|
| LysN ESI |
|
|---|
| TryLysC ESI |
|
|---|
| Try MALDI |
|
|---|
| ChTry MALDI |
|
|---|
| ArgC MALDI |
|
|---|
| LysN MALDI |
|
|---|
| TryLysC MALDI |
|
|---|
| Try LTQ |
|
|---|
| ChTry LTQ |
|
|---|
| ArgC LTQ |
|
|---|
| LysN LTQ |
|
|---|
| TryLysC LTQ |
|
|---|
| Try MSlow |
|
|---|
| ChTry MSlow |
|
|---|
| ArgC MSlow |
|
|---|
| LysN MSlow |
|
|---|
| TryLysC MSlow |
|
|---|
| Try MShigh |
|
|---|
| ChTry MShigh |
|
|---|
| ArgC MShigh |
|
|---|
| LysN MShigh |
|
|---|
| TryLysC MShigh |
|
|---|
General Statistics
Number of major isoforms |
Number of additional isoforms |
Number of all proteins |
Number of amino acids |
Min. Seq. Length |
Max. Seq. Length |
Avg. Seq. Length |
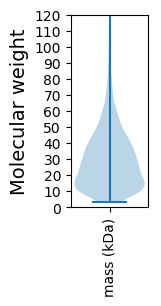
Avg. Mol. Weight |
|---|---|---|---|---|---|---|---|
0 |
760367 |
30 |
2199 |
289.6 |
31.41 |
Amino acid frequency
Ala |
Cys |
Asp |
Glu |
Phe |
Gly |
His |
Ile |
Lys |
Leu |
|---|---|---|---|---|---|---|---|---|---|
11.751 ± 0.064 | 1.166 ± 0.018 |
4.792 ± 0.036 | 5.73 ± 0.052 |
3.169 ± 0.035 | 8.741 ± 0.052 |
2.006 ± 0.027 | 4.055 ± 0.038 |
2.269 ± 0.039 | 13.229 ± 0.079 |
Met |
Asn |
Gln |
Pro |
Arg |
Ser |
Thr |
Val |
Trp |
Tyr |
|---|---|---|---|---|---|---|---|---|---|
1.806 ± 0.019 | 2.287 ± 0.025 |
6.024 ± 0.042 | 4.601 ± 0.036 |
7.436 ± 0.049 | 6.161 ± 0.036 |
4.421 ± 0.03 | 6.837 ± 0.041 |
1.741 ± 0.026 | 1.778 ± 0.025 |
Most of the basic statistics you can see at this page can be downloaded from this CSV file
See this proteome in:

Proteome-pI is available under Creative Commons Attribution-NoDerivs license, for more details see here
| Reference: Kozlowski LP. Proteome-pI 2.0: Proteome Isoelectric Point Database Update. Nucleic Acids Res. 2021, doi: 10.1093/nar/gkab944 | Contact: Lukasz P. Kozlowski |