Streptomyces phage Vondra
Taxonomy: Viruses; Duplodnaviria; Heunggongvirae; Uroviricota; Caudoviricetes; Caudovirales; Siphoviridae; unclassified Siphoviridae
Average proteome isoelectric point is 6.96
Get precalculated fractions of proteins
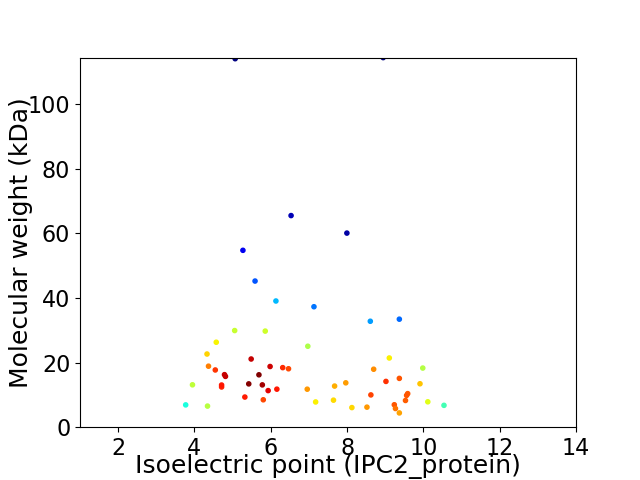
Virtual 2D-PAGE plot for 57 proteins (isoelectric point calculated using IPC2_protein)
Get csv file with sequences according to given criteria:
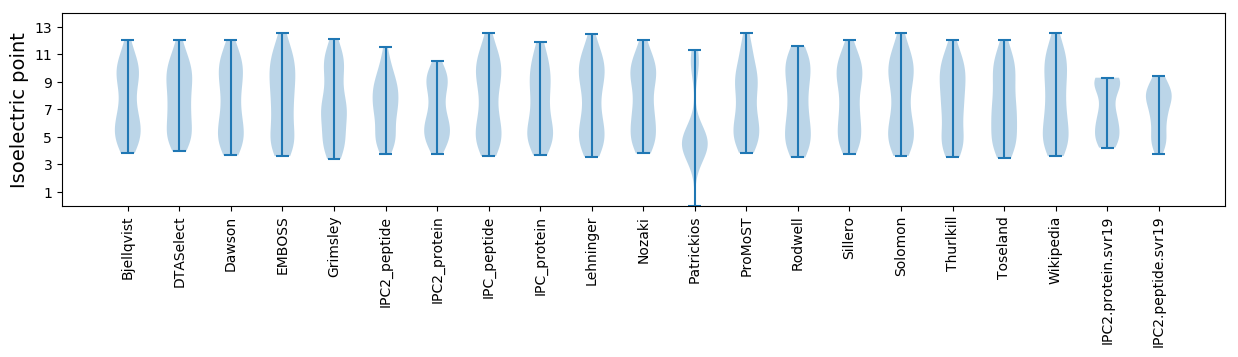
* You can choose from 21 different methods for calculating isoelectric point
Summary statistics related to proteome-wise predictions
Protein with the lowest isoelectric point:
>tr|A0A6M9Z4D8|A0A6M9Z4D8_9CAUD Uncharacterized protein OS=Streptomyces phage Vondra OX=2736273 GN=21 PE=4 SV=1
MM1 pKa = 7.86TYY3 pKa = 9.38TADD6 pKa = 2.92ITTPAGRR13 pKa = 11.84LVCWEE18 pKa = 4.25CNGTGRR24 pKa = 11.84TANPYY29 pKa = 9.93AHH31 pKa = 7.49EE32 pKa = 4.49CTGPLCQGEE41 pKa = 4.41PPVIEE46 pKa = 4.72CTTCDD51 pKa = 3.9GQGHH55 pKa = 6.65TDD57 pKa = 3.13TDD59 pKa = 3.93GFAA62 pKa = 3.99
MM1 pKa = 7.86TYY3 pKa = 9.38TADD6 pKa = 2.92ITTPAGRR13 pKa = 11.84LVCWEE18 pKa = 4.25CNGTGRR24 pKa = 11.84TANPYY29 pKa = 9.93AHH31 pKa = 7.49EE32 pKa = 4.49CTGPLCQGEE41 pKa = 4.41PPVIEE46 pKa = 4.72CTTCDD51 pKa = 3.9GQGHH55 pKa = 6.65TDD57 pKa = 3.13TDD59 pKa = 3.93GFAA62 pKa = 3.99
Molecular weight: 6.54 kDa
Isoelectric point according different methods:
Protein with the highest isoelectric point:
>tr|A0A6M9Z3R5|A0A6M9Z3R5_9CAUD Uncharacterized protein OS=Streptomyces phage Vondra OX=2736273 GN=46 PE=4 SV=1
MM1 pKa = 7.69RR2 pKa = 11.84ASDD5 pKa = 3.92LVPRR9 pKa = 11.84PVEE12 pKa = 3.93LSDD15 pKa = 3.94GVPITPRR22 pKa = 11.84PVTGCAVCAALMKK35 pKa = 10.0QWRR38 pKa = 11.84QATSPGSPAFDD49 pKa = 4.24PSHH52 pKa = 5.91ATDD55 pKa = 3.65LAVEE59 pKa = 4.65IRR61 pKa = 11.84RR62 pKa = 11.84HH63 pKa = 3.87PHH65 pKa = 4.04QYY67 pKa = 10.15KK68 pKa = 9.83RR69 pKa = 11.84RR70 pKa = 11.84QRR72 pKa = 11.84TRR74 pKa = 2.78
MM1 pKa = 7.69RR2 pKa = 11.84ASDD5 pKa = 3.92LVPRR9 pKa = 11.84PVEE12 pKa = 3.93LSDD15 pKa = 3.94GVPITPRR22 pKa = 11.84PVTGCAVCAALMKK35 pKa = 10.0QWRR38 pKa = 11.84QATSPGSPAFDD49 pKa = 4.24PSHH52 pKa = 5.91ATDD55 pKa = 3.65LAVEE59 pKa = 4.65IRR61 pKa = 11.84RR62 pKa = 11.84HH63 pKa = 3.87PHH65 pKa = 4.04QYY67 pKa = 10.15KK68 pKa = 9.83RR69 pKa = 11.84RR70 pKa = 11.84QRR72 pKa = 11.84TRR74 pKa = 2.78
Molecular weight: 8.27 kDa
Isoelectric point according different methods:
Peptides (in silico digests for buttom-up proteomics)
Below you can find in silico digests of the whole proteome with Trypsin, Chymotrypsin, Trypsin+LysC, LysN, ArgC proteases suitable for different mass spec machines.| Try ESI |
 |
|---|
| ChTry ESI |
|
|---|
| ArgC ESI |
|
|---|
| LysN ESI |
|
|---|
| TryLysC ESI |
|
|---|
| Try MALDI |
|
|---|
| ChTry MALDI |
|
|---|
| ArgC MALDI |
|
|---|
| LysN MALDI |
|
|---|
| TryLysC MALDI |
|
|---|
| Try LTQ |
|
|---|
| ChTry LTQ |
|
|---|
| ArgC LTQ |
|
|---|
| LysN LTQ |
|
|---|
| TryLysC LTQ |
|
|---|
| Try MSlow |
|
|---|
| ChTry MSlow |
|
|---|
| ArgC MSlow |
|
|---|
| LysN MSlow |
|
|---|
| TryLysC MSlow |
|
|---|
| Try MShigh |
|
|---|
| ChTry MShigh |
|
|---|
| ArgC MShigh |
|
|---|
| LysN MShigh |
|
|---|
| TryLysC MShigh |
|
|---|
General Statistics
Number of major isoforms |
Number of additional isoforms |
Number of all proteins |
Number of amino acids |
Min. Seq. Length |
Max. Seq. Length |
Avg. Seq. Length |
Avg. Mol. Weight |
|---|---|---|---|---|---|---|---|
0 |
11603 |
38 |
1116 |
203.6 |
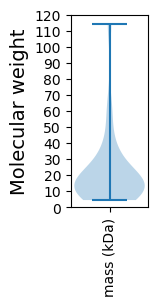
21.91 |
Amino acid frequency
Ala |
Cys |
Asp |
Glu |
Phe |
Gly |
His |
Ile |
Lys |
Leu |
|---|---|---|---|---|---|---|---|---|---|
15.66 ± 0.498 | 1.051 ± 0.168 |
6.645 ± 0.281 | 5.076 ± 0.25 |
1.465 ± 0.114 | 8.265 ± 0.534 |
2.112 ± 0.216 | 3.378 ± 0.246 |
2.396 ± 0.409 | 8.075 ± 0.295 |
Met |
Asn |
Gln |
Pro |
Arg |
Ser |
Thr |
Val |
Trp |
Tyr |
|---|---|---|---|---|---|---|---|---|---|
1.982 ± 0.113 | 1.594 ± 0.137 |
6.464 ± 0.504 | 3.956 ± 0.282 |
9.205 ± 0.5 | 4.499 ± 0.261 |
7.843 ± 0.411 | 6.197 ± 0.286 |
1.896 ± 0.166 | 2.241 ± 0.166 |
Most of the basic statistics you can see at this page can be downloaded from this CSV file
See this proteome in:

Proteome-pI is available under Creative Commons Attribution-NoDerivs license, for more details see here
| Reference: Kozlowski LP. Proteome-pI 2.0: Proteome Isoelectric Point Database Update. Nucleic Acids Res. 2021, doi: 10.1093/nar/gkab944 | Contact: Lukasz P. Kozlowski |