Raphanus sativus (Radish) (Raphanus raphanistrum var. sativus)
Taxonomy: cellular organisms; Eukaryota; Viridiplantae; Streptophyta; Streptophytina; Embryophyta; Tracheophyta; Euphyllophyta; Spermatophyta; Magnoliopsida; Mesangiospermae; eudicotyledons; Gunneridae; Pentapetalae; rosids; malvids; Brassicales; Brassicaceae; Brassiceae; Raphanus
Average proteome isoelectric point is 6.74
Get precalculated fractions of proteins
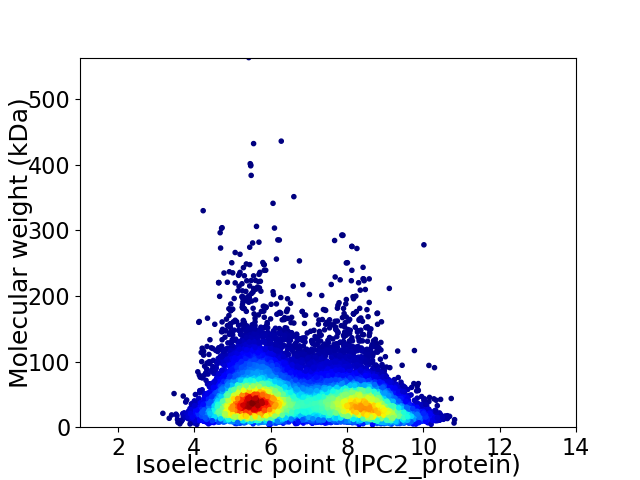
Virtual 2D-PAGE plot for 52798 proteins (isoelectric point calculated using IPC2_protein)
Get csv file with sequences according to given criteria:
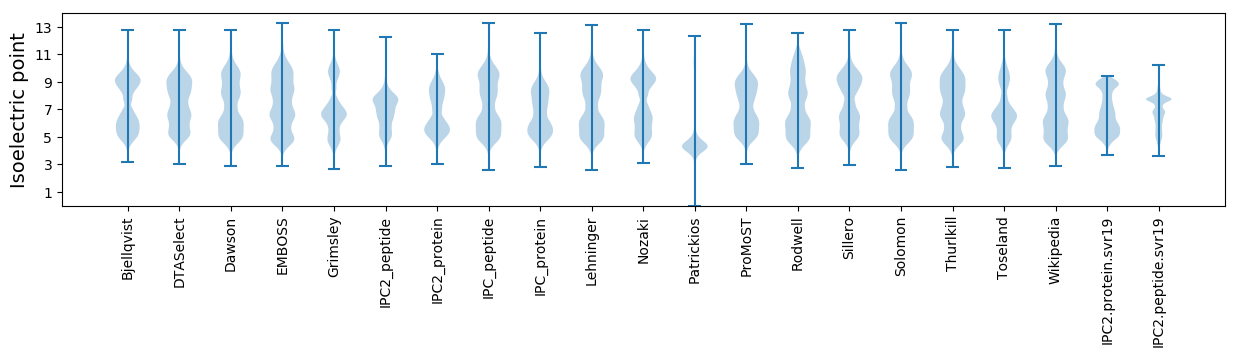
* You can choose from 21 different methods for calculating isoelectric point
Summary statistics related to proteome-wise predictions
Protein with the lowest isoelectric point:
>tr|A0A6J0MYV0|A0A6J0MYV0_RAPSA LOW QUALITY PROTEIN: uncharacterized protein LOC108848700 OS=Raphanus sativus OX=3726 GN=LOC108848700 PE=4 SV=1
MM1 pKa = 7.75LDD3 pKa = 2.88IAYY6 pKa = 9.42EE7 pKa = 4.09LVGQATSNSLLMFCFCNLIIVMIITGSSKK36 pKa = 10.6PGSTDD41 pKa = 3.12SQDD44 pKa = 3.51YY45 pKa = 8.95TFTTSVNFNMCSSLASQDD63 pKa = 4.18HH64 pKa = 7.06DD65 pKa = 4.52CCDD68 pKa = 4.43DD69 pKa = 4.91DD70 pKa = 6.41DD71 pKa = 4.84DD72 pKa = 5.83HH73 pKa = 9.48EE74 pKa = 4.38EE75 pKa = 4.08MIVIDD80 pKa = 3.87VSSAQDD86 pKa = 3.44EE87 pKa = 4.59PLTDD91 pKa = 3.58ASSISEE97 pKa = 4.23GYY99 pKa = 8.91EE100 pKa = 3.8DD101 pKa = 5.35KK102 pKa = 10.96EE103 pKa = 5.13SSHH106 pKa = 6.96CCDD109 pKa = 4.6NNGEE113 pKa = 4.8DD114 pKa = 6.06DD115 pKa = 6.38DD116 pKa = 7.62DD117 pKa = 7.38DD118 pKa = 7.53DD119 pKa = 7.02DD120 pKa = 6.61DD121 pKa = 5.33NEE123 pKa = 4.67SNEE126 pKa = 3.96TDD128 pKa = 3.43VEE130 pKa = 4.2EE131 pKa = 4.57EE132 pKa = 4.3EE133 pKa = 5.02EE134 pKa = 4.32DD135 pKa = 3.89DD136 pKa = 4.13EE137 pKa = 4.41LRR139 pKa = 11.84KK140 pKa = 9.81RR141 pKa = 11.84AEE143 pKa = 3.73EE144 pKa = 4.53FIAKK148 pKa = 9.51VNNEE152 pKa = 3.72WKK154 pKa = 10.27HH155 pKa = 4.85EE156 pKa = 3.96KK157 pKa = 10.29LRR159 pKa = 11.84ALSLVYY165 pKa = 10.61
MM1 pKa = 7.75LDD3 pKa = 2.88IAYY6 pKa = 9.42EE7 pKa = 4.09LVGQATSNSLLMFCFCNLIIVMIITGSSKK36 pKa = 10.6PGSTDD41 pKa = 3.12SQDD44 pKa = 3.51YY45 pKa = 8.95TFTTSVNFNMCSSLASQDD63 pKa = 4.18HH64 pKa = 7.06DD65 pKa = 4.52CCDD68 pKa = 4.43DD69 pKa = 4.91DD70 pKa = 6.41DD71 pKa = 4.84DD72 pKa = 5.83HH73 pKa = 9.48EE74 pKa = 4.38EE75 pKa = 4.08MIVIDD80 pKa = 3.87VSSAQDD86 pKa = 3.44EE87 pKa = 4.59PLTDD91 pKa = 3.58ASSISEE97 pKa = 4.23GYY99 pKa = 8.91EE100 pKa = 3.8DD101 pKa = 5.35KK102 pKa = 10.96EE103 pKa = 5.13SSHH106 pKa = 6.96CCDD109 pKa = 4.6NNGEE113 pKa = 4.8DD114 pKa = 6.06DD115 pKa = 6.38DD116 pKa = 7.62DD117 pKa = 7.38DD118 pKa = 7.53DD119 pKa = 7.02DD120 pKa = 6.61DD121 pKa = 5.33NEE123 pKa = 4.67SNEE126 pKa = 3.96TDD128 pKa = 3.43VEE130 pKa = 4.2EE131 pKa = 4.57EE132 pKa = 4.3EE133 pKa = 5.02EE134 pKa = 4.32DD135 pKa = 3.89DD136 pKa = 4.13EE137 pKa = 4.41LRR139 pKa = 11.84KK140 pKa = 9.81RR141 pKa = 11.84AEE143 pKa = 3.73EE144 pKa = 4.53FIAKK148 pKa = 9.51VNNEE152 pKa = 3.72WKK154 pKa = 10.27HH155 pKa = 4.85EE156 pKa = 3.96KK157 pKa = 10.29LRR159 pKa = 11.84ALSLVYY165 pKa = 10.61
Molecular weight: 18.55 kDa
Isoelectric point according different methods:
Protein with the highest isoelectric point:
>tr|A0A6J0N5L3|A0A6J0N5L3_RAPSA putative FBD-associated F-box protein At1g05080 OS=Raphanus sativus OX=3726 GN=LOC108850995 PE=4 SV=1
MM1 pKa = 7.57ANSKK5 pKa = 10.51RR6 pKa = 11.84LFGVVRR12 pKa = 11.84RR13 pKa = 11.84NLLRR17 pKa = 11.84RR18 pKa = 11.84SPSTIRR24 pKa = 11.84SSVRR28 pKa = 11.84EE29 pKa = 3.7TSRR32 pKa = 11.84QHH34 pKa = 5.12NAAIKK39 pKa = 9.31IQAFFRR45 pKa = 11.84GHH47 pKa = 6.09LARR50 pKa = 11.84RR51 pKa = 11.84AFRR54 pKa = 11.84ALKK57 pKa = 10.68SLVKK61 pKa = 9.99LQAVARR67 pKa = 11.84GVLVRR72 pKa = 11.84RR73 pKa = 11.84QARR76 pKa = 11.84IALHH80 pKa = 6.34CMHH83 pKa = 7.36ALARR87 pKa = 11.84LQVRR91 pKa = 11.84VRR93 pKa = 11.84ARR95 pKa = 11.84QILSHH100 pKa = 6.56
MM1 pKa = 7.57ANSKK5 pKa = 10.51RR6 pKa = 11.84LFGVVRR12 pKa = 11.84RR13 pKa = 11.84NLLRR17 pKa = 11.84RR18 pKa = 11.84SPSTIRR24 pKa = 11.84SSVRR28 pKa = 11.84EE29 pKa = 3.7TSRR32 pKa = 11.84QHH34 pKa = 5.12NAAIKK39 pKa = 9.31IQAFFRR45 pKa = 11.84GHH47 pKa = 6.09LARR50 pKa = 11.84RR51 pKa = 11.84AFRR54 pKa = 11.84ALKK57 pKa = 10.68SLVKK61 pKa = 9.99LQAVARR67 pKa = 11.84GVLVRR72 pKa = 11.84RR73 pKa = 11.84QARR76 pKa = 11.84IALHH80 pKa = 6.34CMHH83 pKa = 7.36ALARR87 pKa = 11.84LQVRR91 pKa = 11.84VRR93 pKa = 11.84ARR95 pKa = 11.84QILSHH100 pKa = 6.56
Molecular weight: 11.51 kDa
Isoelectric point according different methods:
Peptides (in silico digests for buttom-up proteomics)
Below you can find in silico digests of the whole proteome with Trypsin, Chymotrypsin, Trypsin+LysC, LysN, ArgC proteases suitable for different mass spec machines.| Try ESI |
 |
|---|
| ChTry ESI |
|
|---|
| ArgC ESI |
|
|---|
| LysN ESI |
|
|---|
| TryLysC ESI |
|
|---|
| Try MALDI |
|
|---|
| ChTry MALDI |
|
|---|
| ArgC MALDI |
|
|---|
| LysN MALDI |
|
|---|
| TryLysC MALDI |
|
|---|
| Try LTQ |
|
|---|
| ChTry LTQ |
|
|---|
| ArgC LTQ |
|
|---|
| LysN LTQ |
|
|---|
| TryLysC LTQ |
|
|---|
| Try MSlow |
|
|---|
| ChTry MSlow |
|
|---|
| ArgC MSlow |
|
|---|
| LysN MSlow |
|
|---|
| TryLysC MSlow |
|
|---|
| Try MShigh |
|
|---|
| ChTry MShigh |
|
|---|
| ArgC MShigh |
|
|---|
| LysN MShigh |
|
|---|
| TryLysC MShigh |
|
|---|
General Statistics
Number of major isoforms |
Number of additional isoforms |
Number of all proteins |
Number of amino acids |
Min. Seq. Length |
Max. Seq. Length |
Avg. Seq. Length |
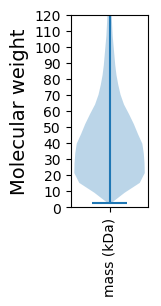
Avg. Mol. Weight |
|---|---|---|---|---|---|---|---|
21790941 |
26 |
5374 |
412.7 |
46.12 |
Amino acid frequency
Ala |
Cys |
Asp |
Glu |
Phe |
Gly |
His |
Ile |
Lys |
Leu |
|---|---|---|---|---|---|---|---|---|---|
6.492 ± 0.01 | 1.814 ± 0.005 |
5.418 ± 0.008 | 6.799 ± 0.013 |
4.142 ± 0.008 | 6.479 ± 0.011 |
2.308 ± 0.005 | 4.987 ± 0.007 |
6.295 ± 0.01 | 9.444 ± 0.012 |
Met |
Asn |
Gln |
Pro |
Arg |
Ser |
Thr |
Val |
Trp |
Tyr |
|---|---|---|---|---|---|---|---|---|---|
2.439 ± 0.004 | 4.257 ± 0.007 |
4.93 ± 0.011 | 3.539 ± 0.006 |
5.559 ± 0.009 | 9.114 ± 0.013 |
5.167 ± 0.006 | 6.749 ± 0.007 |
1.283 ± 0.004 | 2.78 ± 0.005 |
Most of the basic statistics you can see at this page can be downloaded from this CSV file
See this proteome in:

Proteome-pI is available under Creative Commons Attribution-NoDerivs license, for more details see here
| Reference: Kozlowski LP. Proteome-pI 2.0: Proteome Isoelectric Point Database Update. Nucleic Acids Res. 2021, doi: 10.1093/nar/gkab944 | Contact: Lukasz P. Kozlowski |