Paenibacillus sp. D9
Taxonomy: cellular organisms; Bacteria; Terrabacteria group; Firmicutes; Bacilli; Bacillales; Paenibacillaceae; Paenibacillus; unclassified Paenibacillus
Average proteome isoelectric point is 6.44
Get precalculated fractions of proteins
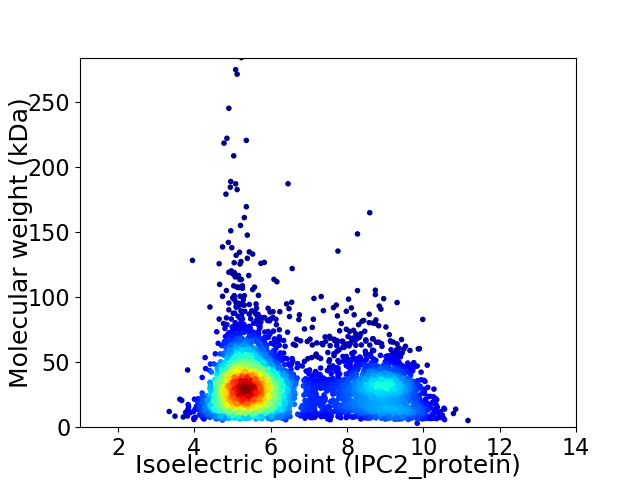
Virtual 2D-PAGE plot for 4351 proteins (isoelectric point calculated using IPC2_protein)
Get csv file with sequences according to given criteria:
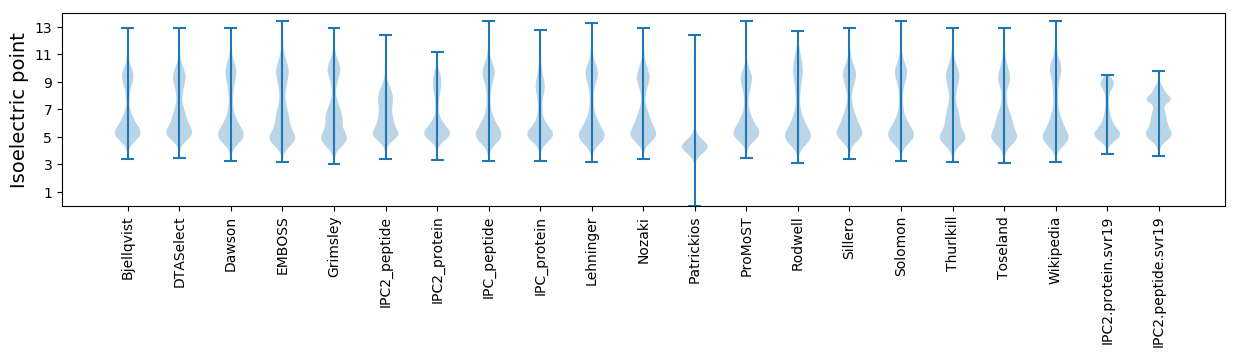
* You can choose from 21 different methods for calculating isoelectric point
Summary statistics related to proteome-wise predictions
Protein with the lowest isoelectric point:
>tr|A0A0F5R0I0|A0A0F5R0I0_9BACL DNA polymerase III PolC-type OS=Paenibacillus sp. D9 OX=665792 GN=polC PE=3 SV=1
MM1 pKa = 7.43PTFDD5 pKa = 3.66SVQVTGSCTVQGALLVGGNQTVQNDD30 pKa = 3.79LQVDD34 pKa = 4.62GNQTIAQGLQVNGSQTILNHH54 pKa = 6.43LDD56 pKa = 3.47VEE58 pKa = 4.86GSAAIGGTVSVFSRR72 pKa = 11.84LIIDD76 pKa = 4.96ALPSAPGIASSPTAVNYY93 pKa = 10.16YY94 pKa = 10.29SSGSAAQPGLVLPGSDD110 pKa = 2.77GSVYY114 pKa = 11.04VLFVDD119 pKa = 4.34VSGAVPALGIQRR131 pKa = 11.84LL132 pKa = 3.67
MM1 pKa = 7.43PTFDD5 pKa = 3.66SVQVTGSCTVQGALLVGGNQTVQNDD30 pKa = 3.79LQVDD34 pKa = 4.62GNQTIAQGLQVNGSQTILNHH54 pKa = 6.43LDD56 pKa = 3.47VEE58 pKa = 4.86GSAAIGGTVSVFSRR72 pKa = 11.84LIIDD76 pKa = 4.96ALPSAPGIASSPTAVNYY93 pKa = 10.16YY94 pKa = 10.29SSGSAAQPGLVLPGSDD110 pKa = 2.77GSVYY114 pKa = 11.04VLFVDD119 pKa = 4.34VSGAVPALGIQRR131 pKa = 11.84LL132 pKa = 3.67
Molecular weight: 13.23 kDa
Isoelectric point according different methods:
Protein with the highest isoelectric point:
>tr|A0A0F5R5W7|A0A0F5R5W7_9BACL Xylose isomerase OS=Paenibacillus sp. D9 OX=665792 GN=VE23_18160 PE=4 SV=1
MM1 pKa = 7.82RR2 pKa = 11.84PTFRR6 pKa = 11.84PNVSKK11 pKa = 10.72RR12 pKa = 11.84KK13 pKa = 8.96KK14 pKa = 8.25VHH16 pKa = 5.49GFRR19 pKa = 11.84KK20 pKa = 9.99RR21 pKa = 11.84MSSKK25 pKa = 10.47NGRR28 pKa = 11.84KK29 pKa = 9.16VLAARR34 pKa = 11.84RR35 pKa = 11.84KK36 pKa = 8.91KK37 pKa = 10.37GRR39 pKa = 11.84SVLSAA44 pKa = 3.74
MM1 pKa = 7.82RR2 pKa = 11.84PTFRR6 pKa = 11.84PNVSKK11 pKa = 10.72RR12 pKa = 11.84KK13 pKa = 8.96KK14 pKa = 8.25VHH16 pKa = 5.49GFRR19 pKa = 11.84KK20 pKa = 9.99RR21 pKa = 11.84MSSKK25 pKa = 10.47NGRR28 pKa = 11.84KK29 pKa = 9.16VLAARR34 pKa = 11.84RR35 pKa = 11.84KK36 pKa = 8.91KK37 pKa = 10.37GRR39 pKa = 11.84SVLSAA44 pKa = 3.74
Molecular weight: 5.11 kDa
Isoelectric point according different methods:
Peptides (in silico digests for buttom-up proteomics)
Below you can find in silico digests of the whole proteome with Trypsin, Chymotrypsin, Trypsin+LysC, LysN, ArgC proteases suitable for different mass spec machines.| Try ESI |
 |
|---|
| ChTry ESI |
|
|---|
| ArgC ESI |
|
|---|
| LysN ESI |
|
|---|
| TryLysC ESI |
|
|---|
| Try MALDI |
|
|---|
| ChTry MALDI |
|
|---|
| ArgC MALDI |
|
|---|
| LysN MALDI |
|
|---|
| TryLysC MALDI |
|
|---|
| Try LTQ |
|
|---|
| ChTry LTQ |
|
|---|
| ArgC LTQ |
|
|---|
| LysN LTQ |
|
|---|
| TryLysC LTQ |
|
|---|
| Try MSlow |
|
|---|
| ChTry MSlow |
|
|---|
| ArgC MSlow |
|
|---|
| LysN MSlow |
|
|---|
| TryLysC MSlow |
|
|---|
| Try MShigh |
|
|---|
| ChTry MShigh |
|
|---|
| ArgC MShigh |
|
|---|
| LysN MShigh |
|
|---|
| TryLysC MShigh |
|
|---|
General Statistics
Number of major isoforms |
Number of additional isoforms |
Number of all proteins |
Number of amino acids |
Min. Seq. Length |
Max. Seq. Length |
Avg. Seq. Length |
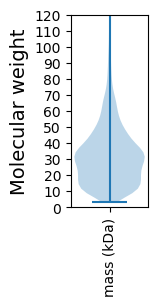
Avg. Mol. Weight |
|---|---|---|---|---|---|---|---|
0 |
1342033 |
26 |
2864 |
308.4 |
33.94 |
Amino acid frequency
Ala |
Cys |
Asp |
Glu |
Phe |
Gly |
His |
Ile |
Lys |
Leu |
|---|---|---|---|---|---|---|---|---|---|
9.963 ± 0.05 | 0.716 ± 0.011 |
5.123 ± 0.03 | 6.681 ± 0.048 |
3.856 ± 0.03 | 8.366 ± 0.04 |
1.919 ± 0.018 | 5.831 ± 0.033 |
4.707 ± 0.037 | 10.462 ± 0.051 |
Met |
Asn |
Gln |
Pro |
Arg |
Ser |
Thr |
Val |
Trp |
Tyr |
|---|---|---|---|---|---|---|---|---|---|
2.811 ± 0.016 | 3.048 ± 0.028 |
4.376 ± 0.028 | 3.475 ± 0.023 |
5.921 ± 0.044 | 6.575 ± 0.034 |
4.875 ± 0.036 | 6.861 ± 0.03 |
1.267 ± 0.015 | 3.164 ± 0.026 |
Most of the basic statistics you can see at this page can be downloaded from this CSV file
See this proteome in:

Proteome-pI is available under Creative Commons Attribution-NoDerivs license, for more details see here
| Reference: Kozlowski LP. Proteome-pI 2.0: Proteome Isoelectric Point Database Update. Nucleic Acids Res. 2021, doi: 10.1093/nar/gkab944 | Contact: Lukasz P. Kozlowski |