Wuhan arthropod virus 1
Taxonomy: Viruses; Riboviria; unclassified Riboviria; unclassified RNA viruses ShiM-2016
Average proteome isoelectric point is 5.77
Get precalculated fractions of proteins
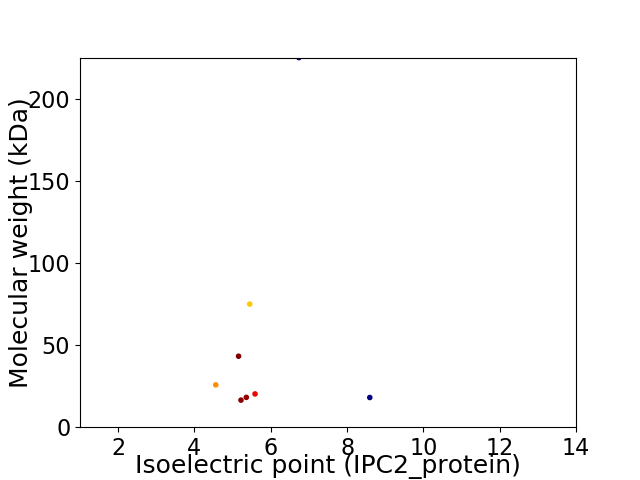
Virtual 2D-PAGE plot for 8 proteins (isoelectric point calculated using IPC2_protein)
Get csv file with sequences according to given criteria:
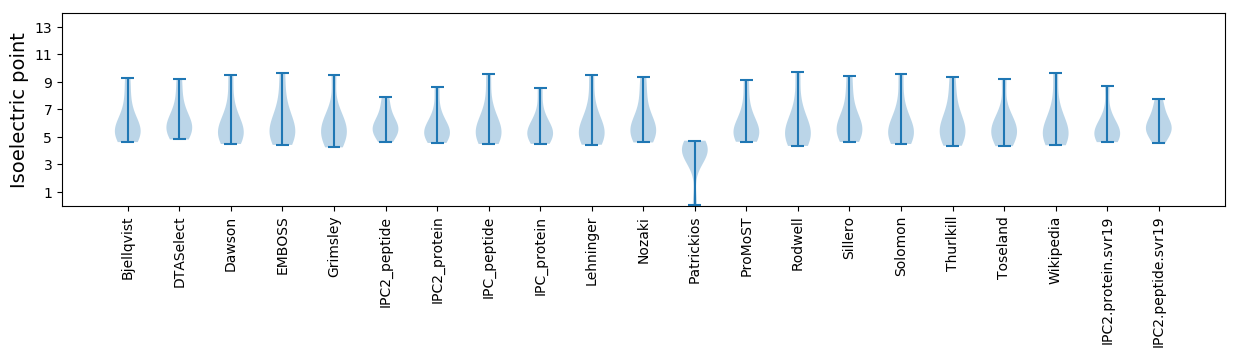
* You can choose from 21 different methods for calculating isoelectric point
Summary statistics related to proteome-wise predictions
Protein with the lowest isoelectric point:
>tr|A0A1L3KKA0|A0A1L3KKA0_9VIRU Uncharacterized protein OS=Wuhan arthropod virus 1 OX=1923690 PE=4 SV=1
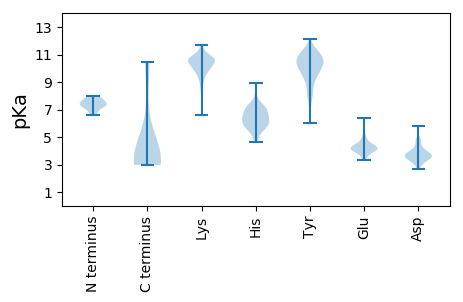
MM1 pKa = 7.86RR2 pKa = 11.84CLILIFCILFACCFDD17 pKa = 4.27FNYY20 pKa = 10.04TADD23 pKa = 3.6QPSYY27 pKa = 10.3ILGGVEE33 pKa = 3.87VTDD36 pKa = 3.82CRR38 pKa = 11.84FIANCTVSYY47 pKa = 8.86QTLSQVNSSVTIVHH61 pKa = 6.89NYY63 pKa = 6.03TQFFVSSAVNVTTQVSVLIYY83 pKa = 10.48RR84 pKa = 11.84GLTDD88 pKa = 3.84GQDD91 pKa = 3.56YY92 pKa = 10.68LYY94 pKa = 10.55AGHH97 pKa = 7.48WGGEE101 pKa = 4.12NFSAVCHH108 pKa = 6.45DD109 pKa = 3.85SEE111 pKa = 6.41FYY113 pKa = 10.75ILWGNNRR120 pKa = 11.84IASYY124 pKa = 11.12KK125 pKa = 10.79SLTTDD130 pKa = 3.13NYY132 pKa = 11.33YY133 pKa = 11.38LLLKK137 pKa = 10.55LPYY140 pKa = 9.6TVDD143 pKa = 3.06VSLNPACDD151 pKa = 2.65ICFILKK157 pKa = 10.39KK158 pKa = 10.32LIQQIKK164 pKa = 8.37PYY166 pKa = 10.28IVVTLEE172 pKa = 3.82DD173 pKa = 3.73YY174 pKa = 8.83RR175 pKa = 11.84TGFRR179 pKa = 11.84YY180 pKa = 9.73PFVATSEE187 pKa = 3.9ICEE190 pKa = 4.2NSDD193 pKa = 2.74ILAPYY198 pKa = 10.38SHH200 pKa = 7.04FTLDD204 pKa = 3.39YY205 pKa = 9.87EE206 pKa = 4.29PDD208 pKa = 3.36YY209 pKa = 10.4FIPIFDD215 pKa = 4.03PEE217 pKa = 4.18IFHH220 pKa = 6.93FNPASS225 pKa = 3.18
MM1 pKa = 7.86RR2 pKa = 11.84CLILIFCILFACCFDD17 pKa = 4.27FNYY20 pKa = 10.04TADD23 pKa = 3.6QPSYY27 pKa = 10.3ILGGVEE33 pKa = 3.87VTDD36 pKa = 3.82CRR38 pKa = 11.84FIANCTVSYY47 pKa = 8.86QTLSQVNSSVTIVHH61 pKa = 6.89NYY63 pKa = 6.03TQFFVSSAVNVTTQVSVLIYY83 pKa = 10.48RR84 pKa = 11.84GLTDD88 pKa = 3.84GQDD91 pKa = 3.56YY92 pKa = 10.68LYY94 pKa = 10.55AGHH97 pKa = 7.48WGGEE101 pKa = 4.12NFSAVCHH108 pKa = 6.45DD109 pKa = 3.85SEE111 pKa = 6.41FYY113 pKa = 10.75ILWGNNRR120 pKa = 11.84IASYY124 pKa = 11.12KK125 pKa = 10.79SLTTDD130 pKa = 3.13NYY132 pKa = 11.33YY133 pKa = 11.38LLLKK137 pKa = 10.55LPYY140 pKa = 9.6TVDD143 pKa = 3.06VSLNPACDD151 pKa = 2.65ICFILKK157 pKa = 10.39KK158 pKa = 10.32LIQQIKK164 pKa = 8.37PYY166 pKa = 10.28IVVTLEE172 pKa = 3.82DD173 pKa = 3.73YY174 pKa = 8.83RR175 pKa = 11.84TGFRR179 pKa = 11.84YY180 pKa = 9.73PFVATSEE187 pKa = 3.9ICEE190 pKa = 4.2NSDD193 pKa = 2.74ILAPYY198 pKa = 10.38SHH200 pKa = 7.04FTLDD204 pKa = 3.39YY205 pKa = 9.87EE206 pKa = 4.29PDD208 pKa = 3.36YY209 pKa = 10.4FIPIFDD215 pKa = 4.03PEE217 pKa = 4.18IFHH220 pKa = 6.93FNPASS225 pKa = 3.18
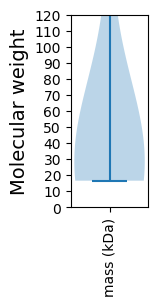
Molecular weight: 25.76 kDa
Isoelectric point according different methods:
Protein with the highest isoelectric point:
>tr|A0A1L3KK17|A0A1L3KK17_9VIRU Uncharacterized protein OS=Wuhan arthropod virus 1 OX=1923690 PE=4 SV=1
MM1 pKa = 6.62LTKK4 pKa = 10.14MFGLYY9 pKa = 10.63FMFGLILIVNSSVTHH24 pKa = 5.64DD25 pKa = 3.97TIIDD29 pKa = 3.61ALNYY33 pKa = 9.57NSKK36 pKa = 10.07ILDD39 pKa = 3.7SLLSLLSEE47 pKa = 4.01ITVTSTSSTANEE59 pKa = 4.38VITNNYY65 pKa = 8.93LSKK68 pKa = 10.62IQVDD72 pKa = 3.41INKK75 pKa = 9.75NYY77 pKa = 9.93HH78 pKa = 6.24LHH80 pKa = 6.48LSWDD84 pKa = 3.62EE85 pKa = 4.0TFNAIDD91 pKa = 3.7RR92 pKa = 11.84FVKK95 pKa = 10.6LGNHH99 pKa = 7.17GIALDD104 pKa = 4.84GIPGTTMSGKK114 pKa = 9.86IKK116 pKa = 10.77SNTAFIICPAMIPMSCRR133 pKa = 11.84IKK135 pKa = 9.9MRR137 pKa = 11.84HH138 pKa = 5.79AKK140 pKa = 10.09FDD142 pKa = 3.37VTRR145 pKa = 11.84THH147 pKa = 7.71DD148 pKa = 3.43YY149 pKa = 10.31TKK151 pKa = 10.65YY152 pKa = 10.71LRR154 pKa = 11.84GGTKK158 pKa = 10.59GLGKK162 pKa = 10.46
MM1 pKa = 6.62LTKK4 pKa = 10.14MFGLYY9 pKa = 10.63FMFGLILIVNSSVTHH24 pKa = 5.64DD25 pKa = 3.97TIIDD29 pKa = 3.61ALNYY33 pKa = 9.57NSKK36 pKa = 10.07ILDD39 pKa = 3.7SLLSLLSEE47 pKa = 4.01ITVTSTSSTANEE59 pKa = 4.38VITNNYY65 pKa = 8.93LSKK68 pKa = 10.62IQVDD72 pKa = 3.41INKK75 pKa = 9.75NYY77 pKa = 9.93HH78 pKa = 6.24LHH80 pKa = 6.48LSWDD84 pKa = 3.62EE85 pKa = 4.0TFNAIDD91 pKa = 3.7RR92 pKa = 11.84FVKK95 pKa = 10.6LGNHH99 pKa = 7.17GIALDD104 pKa = 4.84GIPGTTMSGKK114 pKa = 9.86IKK116 pKa = 10.77SNTAFIICPAMIPMSCRR133 pKa = 11.84IKK135 pKa = 9.9MRR137 pKa = 11.84HH138 pKa = 5.79AKK140 pKa = 10.09FDD142 pKa = 3.37VTRR145 pKa = 11.84THH147 pKa = 7.71DD148 pKa = 3.43YY149 pKa = 10.31TKK151 pKa = 10.65YY152 pKa = 10.71LRR154 pKa = 11.84GGTKK158 pKa = 10.59GLGKK162 pKa = 10.46
Molecular weight: 18.08 kDa
Isoelectric point according different methods:
Peptides (in silico digests for buttom-up proteomics)
Below you can find in silico digests of the whole proteome with Trypsin, Chymotrypsin, Trypsin+LysC, LysN, ArgC proteases suitable for different mass spec machines.| Try ESI |
 |
|---|
| ChTry ESI |
|
|---|
| ArgC ESI |
|
|---|
| LysN ESI |
|
|---|
| TryLysC ESI |
|
|---|
| Try MALDI |
|
|---|
| ChTry MALDI |
|
|---|
| ArgC MALDI |
|
|---|
| LysN MALDI |
|
|---|
| TryLysC MALDI |
|
|---|
| Try LTQ |
|
|---|
| ChTry LTQ |
|
|---|
| ArgC LTQ |
|
|---|
| LysN LTQ |
|
|---|
| TryLysC LTQ |
|
|---|
| Try MSlow |
|
|---|
| ChTry MSlow |
|
|---|
| ArgC MSlow |
|
|---|
| LysN MSlow |
|
|---|
| TryLysC MSlow |
|
|---|
| Try MShigh |
|
|---|
| ChTry MShigh |
|
|---|
| ArgC MShigh |
|
|---|
| LysN MShigh |
|
|---|
| TryLysC MShigh |
|
|---|
General Statistics
Number of major isoforms |
Number of additional isoforms |
Number of all proteins |
Number of amino acids |
Min. Seq. Length |
Max. Seq. Length |
Avg. Seq. Length |
Avg. Mol. Weight |
|---|---|---|---|---|---|---|---|
0 |
3900 |
147 |
1960 |
487.5 |
55.25 |
Amino acid frequency
Ala |
Cys |
Asp |
Glu |
Phe |
Gly |
His |
Ile |
Lys |
Leu |
|---|---|---|---|---|---|---|---|---|---|
5.051 ± 0.474 | 1.949 ± 0.381 |
6.205 ± 0.567 | 5.256 ± 0.573 |
5.026 ± 0.472 | 4.615 ± 0.411 |
2.051 ± 0.17 | 8.718 ± 0.6 |
7.333 ± 1.159 | 9.256 ± 0.603 |
Met |
Asn |
Gln |
Pro |
Arg |
Ser |
Thr |
Val |
Trp |
Tyr |
|---|---|---|---|---|---|---|---|---|---|
2.359 ± 0.322 | 6.795 ± 0.801 |
3.333 ± 0.488 | 3.308 ± 0.29 |
3.231 ± 0.518 | 7.308 ± 0.91 |
6.564 ± 1.309 | 6.718 ± 0.339 |
0.538 ± 0.123 | 4.385 ± 0.552 |
Most of the basic statistics you can see at this page can be downloaded from this CSV file
See this proteome in:

Proteome-pI is available under Creative Commons Attribution-NoDerivs license, for more details see here
| Reference: Kozlowski LP. Proteome-pI 2.0: Proteome Isoelectric Point Database Update. Nucleic Acids Res. 2021, doi: 10.1093/nar/gkab944 | Contact: Lukasz P. Kozlowski |