Pseudoalteromonas phage AL
Taxonomy: Viruses; Duplodnaviria; Heunggongvirae; Uroviricota; Caudoviricetes; Caudovirales; Siphoviridae; unclassified Siphoviridae
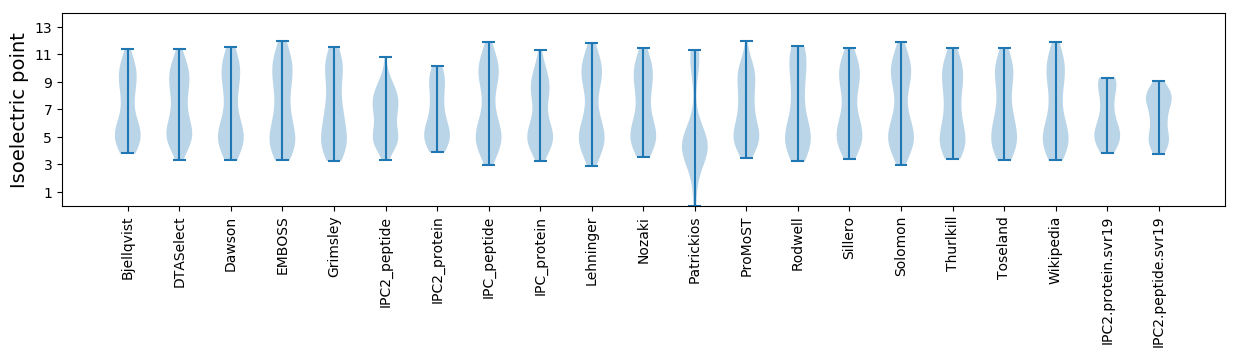
Average proteome isoelectric point is 6.56
Get precalculated fractions of proteins

Virtual 2D-PAGE plot for 52 proteins (isoelectric point calculated using IPC2_protein)
Get csv file with sequences according to given criteria:
* You can choose from 21 different methods for calculating isoelectric point
Summary statistics related to proteome-wise predictions
Protein with the lowest isoelectric point:
>tr|A0A6G6XVF8|A0A6G6XVF8_9CAUD Putative HNH endonuclease OS=Pseudoalteromonas phage AL OX=2712933 PE=4 SV=1
MM1 pKa = 7.34TPAEE5 pKa = 4.51YY6 pKa = 10.52LVLWDD11 pKa = 4.04YY12 pKa = 11.58KK13 pKa = 10.75YY14 pKa = 10.59ATAPEE19 pKa = 4.19YY20 pKa = 10.72EE21 pKa = 4.45EE22 pKa = 3.78QRR24 pKa = 11.84KK25 pKa = 9.47ASEE28 pKa = 4.26LDD30 pKa = 3.12QALIDD35 pKa = 3.89NWDD38 pKa = 3.67LLLL41 pKa = 5.35
MM1 pKa = 7.34TPAEE5 pKa = 4.51YY6 pKa = 10.52LVLWDD11 pKa = 4.04YY12 pKa = 11.58KK13 pKa = 10.75YY14 pKa = 10.59ATAPEE19 pKa = 4.19YY20 pKa = 10.72EE21 pKa = 4.45EE22 pKa = 3.78QRR24 pKa = 11.84KK25 pKa = 9.47ASEE28 pKa = 4.26LDD30 pKa = 3.12QALIDD35 pKa = 3.89NWDD38 pKa = 3.67LLLL41 pKa = 5.35
Molecular weight: 4.91 kDa
Isoelectric point according different methods:
Protein with the highest isoelectric point:
>tr|A0A6G6XVA7|A0A6G6XVA7_9CAUD Uncharacterized protein OS=Pseudoalteromonas phage AL OX=2712933 PE=4 SV=1
MM1 pKa = 7.48NNLSDD6 pKa = 3.71MTDD9 pKa = 3.04LSFTQTKK16 pKa = 9.99RR17 pKa = 11.84AMTSTHH23 pKa = 6.87LSRR26 pKa = 11.84VSHH29 pKa = 6.32QYY31 pKa = 10.67RR32 pKa = 11.84PMWAIAAKK40 pKa = 10.46NNAKK44 pKa = 9.96PKK46 pKa = 9.72VVIDD50 pKa = 3.65RR51 pKa = 11.84VRR53 pKa = 11.84DD54 pKa = 3.88GKK56 pKa = 10.8RR57 pKa = 11.84SNPTVFMGCC66 pKa = 3.58
MM1 pKa = 7.48NNLSDD6 pKa = 3.71MTDD9 pKa = 3.04LSFTQTKK16 pKa = 9.99RR17 pKa = 11.84AMTSTHH23 pKa = 6.87LSRR26 pKa = 11.84VSHH29 pKa = 6.32QYY31 pKa = 10.67RR32 pKa = 11.84PMWAIAAKK40 pKa = 10.46NNAKK44 pKa = 9.96PKK46 pKa = 9.72VVIDD50 pKa = 3.65RR51 pKa = 11.84VRR53 pKa = 11.84DD54 pKa = 3.88GKK56 pKa = 10.8RR57 pKa = 11.84SNPTVFMGCC66 pKa = 3.58
Molecular weight: 7.51 kDa
Isoelectric point according different methods:
Peptides (in silico digests for buttom-up proteomics)
Below you can find in silico digests of the whole proteome with Trypsin, Chymotrypsin, Trypsin+LysC, LysN, ArgC proteases suitable for different mass spec machines.| Try ESI |
 |
|---|
| ChTry ESI |
|
|---|
| ArgC ESI |
|
|---|
| LysN ESI |
|
|---|
| TryLysC ESI |
|
|---|
| Try MALDI |
|
|---|
| ChTry MALDI |
|
|---|
| ArgC MALDI |
|
|---|
| LysN MALDI |
|
|---|
| TryLysC MALDI |
|
|---|
| Try LTQ |
|
|---|
| ChTry LTQ |
|
|---|
| ArgC LTQ |
|
|---|
| LysN LTQ |
|
|---|
| TryLysC LTQ |
|
|---|
| Try MSlow |
|
|---|
| ChTry MSlow |
|
|---|
| ArgC MSlow |
|
|---|
| LysN MSlow |
|
|---|
| TryLysC MSlow |
|
|---|
| Try MShigh |
|
|---|
| ChTry MShigh |
|
|---|
| ArgC MShigh |
|
|---|
| LysN MShigh |
|
|---|
| TryLysC MShigh |
|
|---|
General Statistics
Number of major isoforms |
Number of additional isoforms |
Number of all proteins |
Number of amino acids |
Min. Seq. Length |
Max. Seq. Length |
Avg. Seq. Length |
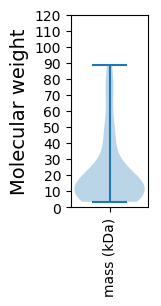
Avg. Mol. Weight |
|---|---|---|---|---|---|---|---|
0 |
10219 |
30 |
779 |
196.5 |
21.87 |
Amino acid frequency
Ala |
Cys |
Asp |
Glu |
Phe |
Gly |
His |
Ile |
Lys |
Leu |
|---|---|---|---|---|---|---|---|---|---|
8.778 ± 0.635 | 0.959 ± 0.134 |
6.322 ± 0.375 | 6.86 ± 0.328 |
3.934 ± 0.187 | 7.124 ± 0.509 |
1.527 ± 0.182 | 6.635 ± 0.211 |
7.496 ± 0.531 | 8.494 ± 0.33 |
Met |
Asn |
Gln |
Pro |
Arg |
Ser |
Thr |
Val |
Trp |
Tyr |
|---|---|---|---|---|---|---|---|---|---|
2.623 ± 0.201 | 5.421 ± 0.23 |
2.887 ± 0.254 | 3.719 ± 0.238 |
4.002 ± 0.299 | 6.39 ± 0.406 |
5.999 ± 0.312 | 6.038 ± 0.227 |
1.213 ± 0.133 | 3.582 ± 0.269 |
Most of the basic statistics you can see at this page can be downloaded from this CSV file
See this proteome in:

Proteome-pI is available under Creative Commons Attribution-NoDerivs license, for more details see here
| Reference: Kozlowski LP. Proteome-pI 2.0: Proteome Isoelectric Point Database Update. Nucleic Acids Res. 2021, doi: 10.1093/nar/gkab944 | Contact: Lukasz P. Kozlowski |