Neodiprion lecontei (Redheaded pine sawfly)
Taxonomy: cellular organisms; Eukaryota; Opisthokonta; Metazoa; Eumetazoa; Bilateria; Protostomia; Ecdysozoa; Panarthropoda; Arthropoda; Mandibulata; Pancrustacea; Hexapoda; Insecta; Dicondylia; Pterygota; Neoptera; Endopterygota; Hymenoptera; Tenthredinoidea; Diprionidae; Diprioninae; Neodiprion<
Average proteome isoelectric point is 6.62
Get precalculated fractions of proteins
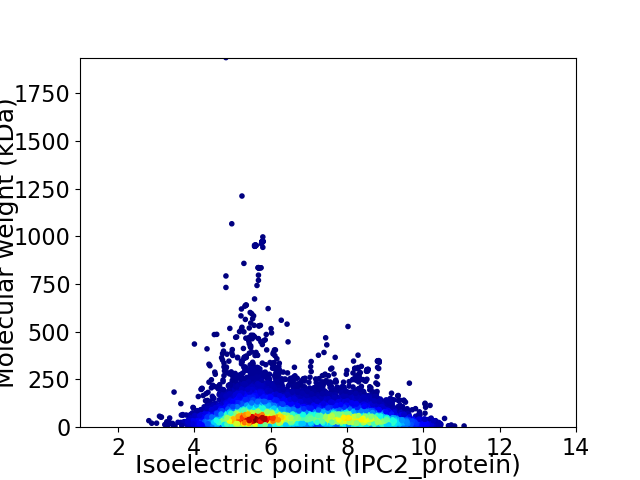
Virtual 2D-PAGE plot for 14458 proteins (isoelectric point calculated using IPC2_protein)
Get csv file with sequences according to given criteria:
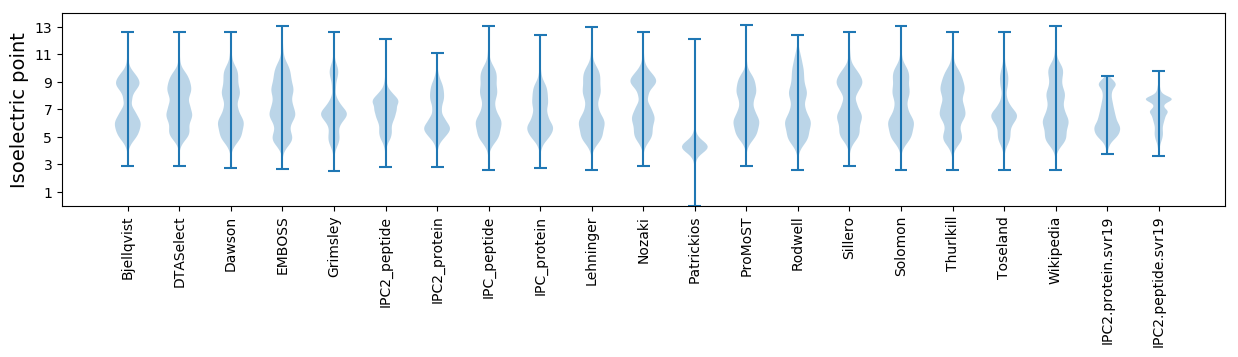
* You can choose from 21 different methods for calculating isoelectric point
Summary statistics related to proteome-wise predictions
Protein with the lowest isoelectric point:
>tr|A0A6J0BA94|A0A6J0BA94_NEOLC Actin-related protein 2 OS=Neodiprion lecontei OX=441921 GN=LOC107218490 PE=3 SV=1
MM1 pKa = 7.07VVLINFLLPQEE12 pKa = 4.61GVRR15 pKa = 11.84HH16 pKa = 5.74EE17 pKa = 4.61EE18 pKa = 3.92PDD20 pKa = 3.19TTLYY24 pKa = 10.78INDD27 pKa = 3.87RR28 pKa = 11.84EE29 pKa = 4.39VGKK32 pKa = 8.85GTLYY36 pKa = 9.55VTEE39 pKa = 5.16SLLSWVSGTTGQGFSLEE56 pKa = 4.14YY57 pKa = 10.49PNISLHH63 pKa = 6.77AISRR67 pKa = 11.84DD68 pKa = 3.8QQLHH72 pKa = 4.89PHH74 pKa = 5.78QYY76 pKa = 10.36LYY78 pKa = 11.9VMVDD82 pKa = 3.44AKK84 pKa = 10.93LDD86 pKa = 3.95PADD89 pKa = 3.87MQEE92 pKa = 4.87LLPIDD97 pKa = 4.12ARR99 pKa = 11.84SEE101 pKa = 4.3GNDD104 pKa = 3.55EE105 pKa = 4.68EE106 pKa = 6.82DD107 pKa = 5.56DD108 pKa = 4.29DD109 pKa = 6.07DD110 pKa = 5.09EE111 pKa = 6.77SEE113 pKa = 4.33TPMTEE118 pKa = 3.47MRR120 pKa = 11.84FVPEE124 pKa = 4.13NSNSLDD130 pKa = 3.4AMFQAMSQCQALHH143 pKa = 7.29PDD145 pKa = 3.59PQAEE149 pKa = 3.82EE150 pKa = 5.3DD151 pKa = 3.59IYY153 pKa = 11.5EE154 pKa = 4.41DD155 pKa = 5.16AEE157 pKa = 5.13DD158 pKa = 5.31DD159 pKa = 5.04VFKK162 pKa = 10.8CWEE165 pKa = 4.28AEE167 pKa = 3.9TDD169 pKa = 3.25AMPYY173 pKa = 10.17ILASDD178 pKa = 3.51EE179 pKa = 4.89AYY181 pKa = 10.43NQNGADD187 pKa = 3.66TDD189 pKa = 3.53EE190 pKa = 5.51AMDD193 pKa = 3.59IEE195 pKa = 4.82AGQFEE200 pKa = 4.86DD201 pKa = 5.63AEE203 pKa = 4.32EE204 pKa = 4.4DD205 pKa = 3.54PP206 pKa = 5.23
MM1 pKa = 7.07VVLINFLLPQEE12 pKa = 4.61GVRR15 pKa = 11.84HH16 pKa = 5.74EE17 pKa = 4.61EE18 pKa = 3.92PDD20 pKa = 3.19TTLYY24 pKa = 10.78INDD27 pKa = 3.87RR28 pKa = 11.84EE29 pKa = 4.39VGKK32 pKa = 8.85GTLYY36 pKa = 9.55VTEE39 pKa = 5.16SLLSWVSGTTGQGFSLEE56 pKa = 4.14YY57 pKa = 10.49PNISLHH63 pKa = 6.77AISRR67 pKa = 11.84DD68 pKa = 3.8QQLHH72 pKa = 4.89PHH74 pKa = 5.78QYY76 pKa = 10.36LYY78 pKa = 11.9VMVDD82 pKa = 3.44AKK84 pKa = 10.93LDD86 pKa = 3.95PADD89 pKa = 3.87MQEE92 pKa = 4.87LLPIDD97 pKa = 4.12ARR99 pKa = 11.84SEE101 pKa = 4.3GNDD104 pKa = 3.55EE105 pKa = 4.68EE106 pKa = 6.82DD107 pKa = 5.56DD108 pKa = 4.29DD109 pKa = 6.07DD110 pKa = 5.09EE111 pKa = 6.77SEE113 pKa = 4.33TPMTEE118 pKa = 3.47MRR120 pKa = 11.84FVPEE124 pKa = 4.13NSNSLDD130 pKa = 3.4AMFQAMSQCQALHH143 pKa = 7.29PDD145 pKa = 3.59PQAEE149 pKa = 3.82EE150 pKa = 5.3DD151 pKa = 3.59IYY153 pKa = 11.5EE154 pKa = 4.41DD155 pKa = 5.16AEE157 pKa = 5.13DD158 pKa = 5.31DD159 pKa = 5.04VFKK162 pKa = 10.8CWEE165 pKa = 4.28AEE167 pKa = 3.9TDD169 pKa = 3.25AMPYY173 pKa = 10.17ILASDD178 pKa = 3.51EE179 pKa = 4.89AYY181 pKa = 10.43NQNGADD187 pKa = 3.66TDD189 pKa = 3.53EE190 pKa = 5.51AMDD193 pKa = 3.59IEE195 pKa = 4.82AGQFEE200 pKa = 4.86DD201 pKa = 5.63AEE203 pKa = 4.32EE204 pKa = 4.4DD205 pKa = 3.54PP206 pKa = 5.23
Molecular weight: 23.27 kDa
Isoelectric point according different methods:
Protein with the highest isoelectric point:
>tr|A0A6J0BWA8|A0A6J0BWA8_NEOLC ATP synthase subunit delta mitochondrial OS=Neodiprion lecontei OX=441921 GN=LOC107223444 PE=3 SV=1
MM1 pKa = 7.44SAHH4 pKa = 6.25KK5 pKa = 9.51TFIVKK10 pKa = 10.33RR11 pKa = 11.84KK12 pKa = 8.73LAKK15 pKa = 9.93KK16 pKa = 10.12LKK18 pKa = 8.64QNRR21 pKa = 11.84PIPQWVRR28 pKa = 11.84MRR30 pKa = 11.84TGNTIRR36 pKa = 11.84YY37 pKa = 5.79NAKK40 pKa = 8.47RR41 pKa = 11.84RR42 pKa = 11.84HH43 pKa = 4.1WRR45 pKa = 11.84RR46 pKa = 11.84TKK48 pKa = 10.89LKK50 pKa = 10.55LL51 pKa = 3.39
MM1 pKa = 7.44SAHH4 pKa = 6.25KK5 pKa = 9.51TFIVKK10 pKa = 10.33RR11 pKa = 11.84KK12 pKa = 8.73LAKK15 pKa = 9.93KK16 pKa = 10.12LKK18 pKa = 8.64QNRR21 pKa = 11.84PIPQWVRR28 pKa = 11.84MRR30 pKa = 11.84TGNTIRR36 pKa = 11.84YY37 pKa = 5.79NAKK40 pKa = 8.47RR41 pKa = 11.84RR42 pKa = 11.84HH43 pKa = 4.1WRR45 pKa = 11.84RR46 pKa = 11.84TKK48 pKa = 10.89LKK50 pKa = 10.55LL51 pKa = 3.39
Molecular weight: 6.34 kDa
Isoelectric point according different methods:
Peptides (in silico digests for buttom-up proteomics)
Below you can find in silico digests of the whole proteome with Trypsin, Chymotrypsin, Trypsin+LysC, LysN, ArgC proteases suitable for different mass spec machines.| Try ESI |
 |
|---|
| ChTry ESI |
|
|---|
| ArgC ESI |
|
|---|
| LysN ESI |
|
|---|
| TryLysC ESI |
|
|---|
| Try MALDI |
|
|---|
| ChTry MALDI |
|
|---|
| ArgC MALDI |
|
|---|
| LysN MALDI |
|
|---|
| TryLysC MALDI |
|
|---|
| Try LTQ |
|
|---|
| ChTry LTQ |
|
|---|
| ArgC LTQ |
|
|---|
| LysN LTQ |
|
|---|
| TryLysC LTQ |
|
|---|
| Try MSlow |
|
|---|
| ChTry MSlow |
|
|---|
| ArgC MSlow |
|
|---|
| LysN MSlow |
|
|---|
| TryLysC MSlow |
|
|---|
| Try MShigh |
|
|---|
| ChTry MShigh |
|
|---|
| ArgC MShigh |
|
|---|
| LysN MShigh |
|
|---|
| TryLysC MShigh |
|
|---|
General Statistics
Number of major isoforms |
Number of additional isoforms |
Number of all proteins |
Number of amino acids |
Min. Seq. Length |
Max. Seq. Length |
Avg. Seq. Length |
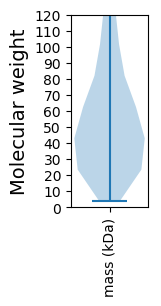
Avg. Mol. Weight |
|---|---|---|---|---|---|---|---|
9009225 |
34 |
18177 |
623.1 |
69.68 |
Amino acid frequency
Ala |
Cys |
Asp |
Glu |
Phe |
Gly |
His |
Ile |
Lys |
Leu |
|---|---|---|---|---|---|---|---|---|---|
6.623 ± 0.021 | 1.824 ± 0.03 |
5.546 ± 0.021 | 6.83 ± 0.028 |
3.433 ± 0.015 | 6.02 ± 0.028 |
2.457 ± 0.012 | 5.277 ± 0.017 |
6.108 ± 0.04 | 8.955 ± 0.036 |
Met |
Asn |
Gln |
Pro |
Arg |
Ser |
Thr |
Val |
Trp |
Tyr |
|---|---|---|---|---|---|---|---|---|---|
2.176 ± 0.012 | 4.765 ± 0.017 |
5.428 ± 0.025 | 4.327 ± 0.022 |
5.633 ± 0.02 | 8.244 ± 0.028 |
5.994 ± 0.017 | 6.331 ± 0.017 |
1.093 ± 0.007 | 2.918 ± 0.013 |
Most of the basic statistics you can see at this page can be downloaded from this CSV file
See this proteome in:

Proteome-pI is available under Creative Commons Attribution-NoDerivs license, for more details see here
| Reference: Kozlowski LP. Proteome-pI 2.0: Proteome Isoelectric Point Database Update. Nucleic Acids Res. 2021, doi: 10.1093/nar/gkab944 | Contact: Lukasz P. Kozlowski |