Cellulomonas sp. PSBB021
Taxonomy: cellular organisms; Bacteria; Terrabacteria group; Actinobacteria; Actinomycetia; Micrococcales; Cellulomonadaceae; Cellulomonas; unclassified Cellulomonas
Average proteome isoelectric point is 6.18
Get precalculated fractions of proteins
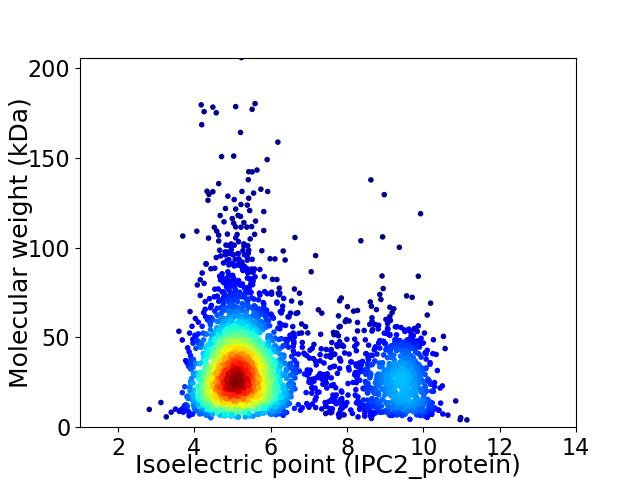
Virtual 2D-PAGE plot for 3224 proteins (isoelectric point calculated using IPC2_protein)
Get csv file with sequences according to given criteria:
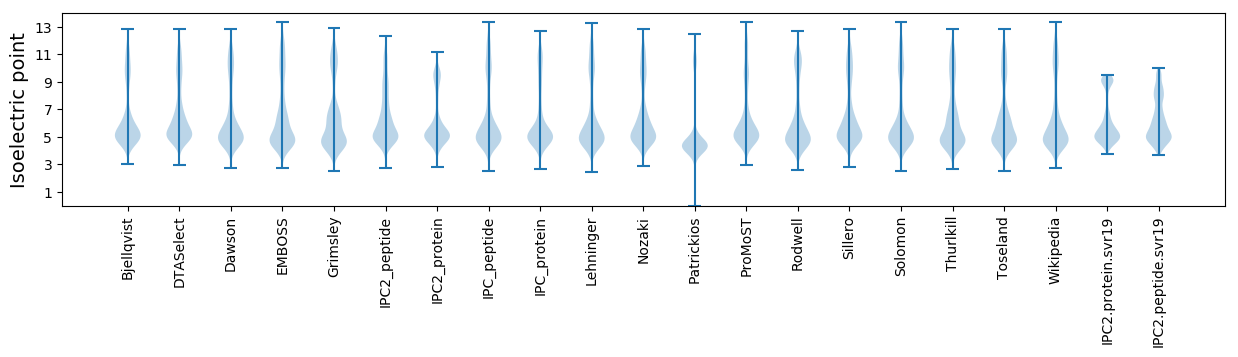
* You can choose from 21 different methods for calculating isoelectric point
Summary statistics related to proteome-wise predictions
Protein with the lowest isoelectric point:
>tr|A0A222XBX1|A0A222XBX1_9CELL Peptidase_M23 domain-containing protein OS=Cellulomonas sp. PSBB021 OX=2003551 GN=CBP52_10650 PE=4 SV=1
MM1 pKa = 7.46LPSKK5 pKa = 9.78SLRR8 pKa = 11.84TAGLASGALAALLALSACSSSSSATDD34 pKa = 3.56DD35 pKa = 3.39ATTAAPAAGAYY46 pKa = 9.5QSLADD51 pKa = 4.08SSACVDD57 pKa = 4.0LRR59 pKa = 11.84EE60 pKa = 4.32TNPDD64 pKa = 3.12LVGTTKK70 pKa = 10.46TNALNPHH77 pKa = 5.19TPGYY81 pKa = 10.45EE82 pKa = 4.11VIDD85 pKa = 4.28PEE87 pKa = 5.76NPDD90 pKa = 3.17QYY92 pKa = 11.23IGFDD96 pKa = 3.3IDD98 pKa = 3.26LGEE101 pKa = 5.45AIGACLGFEE110 pKa = 4.0VDD112 pKa = 4.08YY113 pKa = 11.1IPVGFAEE120 pKa = 5.9LIPTVASGQADD131 pKa = 3.87WIVSNLYY138 pKa = 9.01ATEE141 pKa = 3.8EE142 pKa = 4.06RR143 pKa = 11.84AQGGVDD149 pKa = 4.49FISYY153 pKa = 10.73SKK155 pKa = 11.02VFDD158 pKa = 5.15GILVTTGNPKK168 pKa = 10.69GITGIDD174 pKa = 3.32TSVCGTTVALNKK186 pKa = 10.51GYY188 pKa = 11.09VEE190 pKa = 4.44VPLVEE195 pKa = 4.82AMGPEE200 pKa = 4.52CEE202 pKa = 4.5KK203 pKa = 11.07AGLPAPTVSLFDD215 pKa = 3.8SSADD219 pKa = 3.46CVQAILAGRR228 pKa = 11.84ADD230 pKa = 4.08AYY232 pKa = 10.87MNDD235 pKa = 2.91INTVKK240 pKa = 10.58GYY242 pKa = 9.95IAEE245 pKa = 4.74HH246 pKa = 6.8PDD248 pKa = 3.49EE249 pKa = 5.35LDD251 pKa = 3.39SAEE254 pKa = 4.23TVMLDD259 pKa = 3.25YY260 pKa = 11.0EE261 pKa = 4.21IGIGVLQGDD270 pKa = 3.91HH271 pKa = 7.04AFRR274 pKa = 11.84DD275 pKa = 4.01AVQAALLEE283 pKa = 4.33IQNSGLQAEE292 pKa = 5.33LATKK296 pKa = 9.69WKK298 pKa = 10.36LDD300 pKa = 3.73EE301 pKa = 4.38NAVAEE306 pKa = 4.16PSILSVGG313 pKa = 3.5
MM1 pKa = 7.46LPSKK5 pKa = 9.78SLRR8 pKa = 11.84TAGLASGALAALLALSACSSSSSATDD34 pKa = 3.56DD35 pKa = 3.39ATTAAPAAGAYY46 pKa = 9.5QSLADD51 pKa = 4.08SSACVDD57 pKa = 4.0LRR59 pKa = 11.84EE60 pKa = 4.32TNPDD64 pKa = 3.12LVGTTKK70 pKa = 10.46TNALNPHH77 pKa = 5.19TPGYY81 pKa = 10.45EE82 pKa = 4.11VIDD85 pKa = 4.28PEE87 pKa = 5.76NPDD90 pKa = 3.17QYY92 pKa = 11.23IGFDD96 pKa = 3.3IDD98 pKa = 3.26LGEE101 pKa = 5.45AIGACLGFEE110 pKa = 4.0VDD112 pKa = 4.08YY113 pKa = 11.1IPVGFAEE120 pKa = 5.9LIPTVASGQADD131 pKa = 3.87WIVSNLYY138 pKa = 9.01ATEE141 pKa = 3.8EE142 pKa = 4.06RR143 pKa = 11.84AQGGVDD149 pKa = 4.49FISYY153 pKa = 10.73SKK155 pKa = 11.02VFDD158 pKa = 5.15GILVTTGNPKK168 pKa = 10.69GITGIDD174 pKa = 3.32TSVCGTTVALNKK186 pKa = 10.51GYY188 pKa = 11.09VEE190 pKa = 4.44VPLVEE195 pKa = 4.82AMGPEE200 pKa = 4.52CEE202 pKa = 4.5KK203 pKa = 11.07AGLPAPTVSLFDD215 pKa = 3.8SSADD219 pKa = 3.46CVQAILAGRR228 pKa = 11.84ADD230 pKa = 4.08AYY232 pKa = 10.87MNDD235 pKa = 2.91INTVKK240 pKa = 10.58GYY242 pKa = 9.95IAEE245 pKa = 4.74HH246 pKa = 6.8PDD248 pKa = 3.49EE249 pKa = 5.35LDD251 pKa = 3.39SAEE254 pKa = 4.23TVMLDD259 pKa = 3.25YY260 pKa = 11.0EE261 pKa = 4.21IGIGVLQGDD270 pKa = 3.91HH271 pKa = 7.04AFRR274 pKa = 11.84DD275 pKa = 4.01AVQAALLEE283 pKa = 4.33IQNSGLQAEE292 pKa = 5.33LATKK296 pKa = 9.69WKK298 pKa = 10.36LDD300 pKa = 3.73EE301 pKa = 4.38NAVAEE306 pKa = 4.16PSILSVGG313 pKa = 3.5
Molecular weight: 32.43 kDa
Isoelectric point according different methods:
Protein with the highest isoelectric point:
>tr|A0A222XBS4|A0A222XBS4_9CELL TetR family transcriptional regulator OS=Cellulomonas sp. PSBB021 OX=2003551 GN=CBP52_12300 PE=4 SV=1
MM1 pKa = 7.4GSVIKK6 pKa = 10.42KK7 pKa = 8.47RR8 pKa = 11.84RR9 pKa = 11.84KK10 pKa = 9.22RR11 pKa = 11.84MAKK14 pKa = 9.41KK15 pKa = 9.87KK16 pKa = 9.7HH17 pKa = 5.84RR18 pKa = 11.84KK19 pKa = 8.56LLRR22 pKa = 11.84KK23 pKa = 7.78TRR25 pKa = 11.84HH26 pKa = 3.65QRR28 pKa = 11.84RR29 pKa = 11.84NKK31 pKa = 9.78KK32 pKa = 9.85
MM1 pKa = 7.4GSVIKK6 pKa = 10.42KK7 pKa = 8.47RR8 pKa = 11.84RR9 pKa = 11.84KK10 pKa = 9.22RR11 pKa = 11.84MAKK14 pKa = 9.41KK15 pKa = 9.87KK16 pKa = 9.7HH17 pKa = 5.84RR18 pKa = 11.84KK19 pKa = 8.56LLRR22 pKa = 11.84KK23 pKa = 7.78TRR25 pKa = 11.84HH26 pKa = 3.65QRR28 pKa = 11.84RR29 pKa = 11.84NKK31 pKa = 9.78KK32 pKa = 9.85
Molecular weight: 4.08 kDa
Isoelectric point according different methods:
Peptides (in silico digests for buttom-up proteomics)
Below you can find in silico digests of the whole proteome with Trypsin, Chymotrypsin, Trypsin+LysC, LysN, ArgC proteases suitable for different mass spec machines.| Try ESI |
 |
|---|
| ChTry ESI |
|
|---|
| ArgC ESI |
|
|---|
| LysN ESI |
|
|---|
| TryLysC ESI |
|
|---|
| Try MALDI |
|
|---|
| ChTry MALDI |
|
|---|
| ArgC MALDI |
|
|---|
| LysN MALDI |
|
|---|
| TryLysC MALDI |
|
|---|
| Try LTQ |
|
|---|
| ChTry LTQ |
|
|---|
| ArgC LTQ |
|
|---|
| LysN LTQ |
|
|---|
| TryLysC LTQ |
|
|---|
| Try MSlow |
|
|---|
| ChTry MSlow |
|
|---|
| ArgC MSlow |
|
|---|
| LysN MSlow |
|
|---|
| TryLysC MSlow |
|
|---|
| Try MShigh |
|
|---|
| ChTry MShigh |
|
|---|
| ArgC MShigh |
|
|---|
| LysN MShigh |
|
|---|
| TryLysC MShigh |
|
|---|
General Statistics
Number of major isoforms |
Number of additional isoforms |
Number of all proteins |
Number of amino acids |
Min. Seq. Length |
Max. Seq. Length |
Avg. Seq. Length |
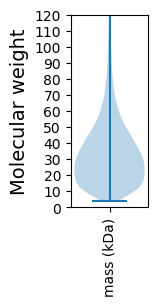
Avg. Mol. Weight |
|---|---|---|---|---|---|---|---|
0 |
1072490 |
32 |
1984 |
332.7 |
35.33 |
Amino acid frequency
Ala |
Cys |
Asp |
Glu |
Phe |
Gly |
His |
Ile |
Lys |
Leu |
|---|---|---|---|---|---|---|---|---|---|
14.477 ± 0.068 | 0.613 ± 0.01 |
6.584 ± 0.033 | 5.187 ± 0.041 |
2.447 ± 0.025 | 9.226 ± 0.041 |
2.162 ± 0.024 | 2.617 ± 0.034 |
1.478 ± 0.029 | 10.123 ± 0.056 |
Met |
Asn |
Gln |
Pro |
Arg |
Ser |
Thr |
Val |
Trp |
Tyr |
|---|---|---|---|---|---|---|---|---|---|
1.445 ± 0.018 | 1.458 ± 0.025 |
5.973 ± 0.036 | 2.693 ± 0.024 |
8.205 ± 0.061 | 4.996 ± 0.038 |
6.503 ± 0.051 | 10.39 ± 0.045 |
1.599 ± 0.019 | 1.824 ± 0.023 |
Most of the basic statistics you can see at this page can be downloaded from this CSV file
See this proteome in:

Proteome-pI is available under Creative Commons Attribution-NoDerivs license, for more details see here
| Reference: Kozlowski LP. Proteome-pI 2.0: Proteome Isoelectric Point Database Update. Nucleic Acids Res. 2021, doi: 10.1093/nar/gkab944 | Contact: Lukasz P. Kozlowski |