Lactococcus phage GE1
Taxonomy: Viruses; Duplodnaviria; Heunggongvirae; Uroviricota; Caudoviricetes; Caudovirales; Siphoviridae; Chertseyvirus; Lactococcus virus GE1
Average proteome isoelectric point is 6.68
Get precalculated fractions of proteins
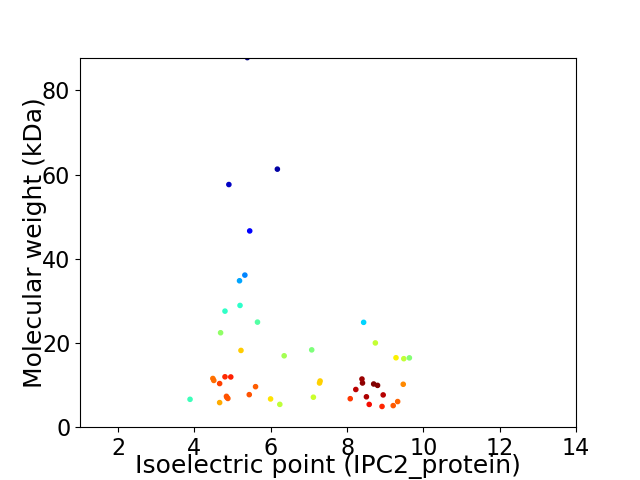
Virtual 2D-PAGE plot for 48 proteins (isoelectric point calculated using IPC2_protein)
Get csv file with sequences according to given criteria:
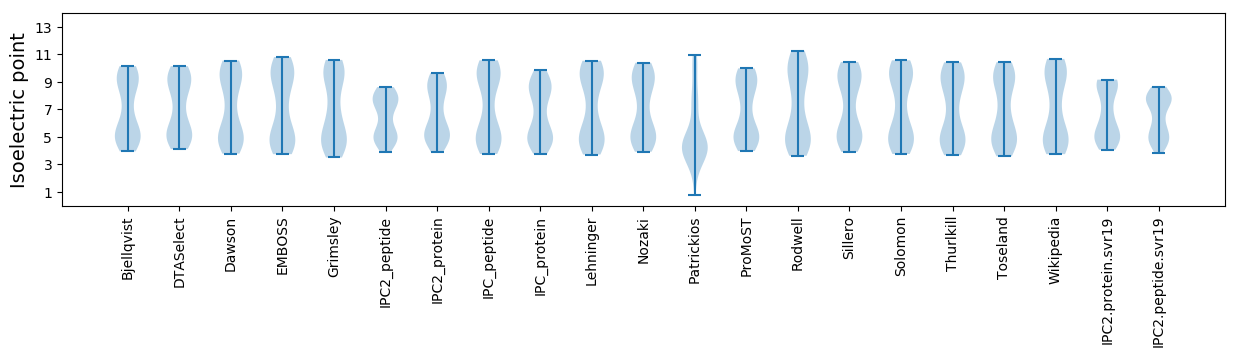
* You can choose from 21 different methods for calculating isoelectric point
Summary statistics related to proteome-wise predictions
Protein with the lowest isoelectric point:
>tr|A0A0N9BAV4|A0A0N9BAV4_9CAUD Uncharacterized protein OS=Lactococcus phage GE1 OX=1698369 PE=4 SV=1
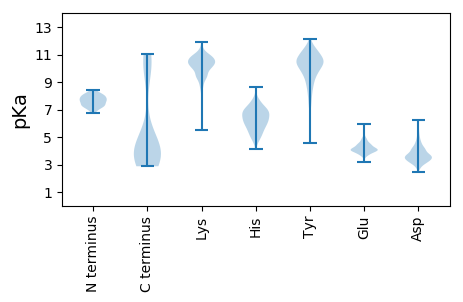
MM1 pKa = 7.54TSPIKK6 pKa = 9.82LTPQEE11 pKa = 3.91MDD13 pKa = 3.45MLLKK17 pKa = 10.74DD18 pKa = 2.96IATQIEE24 pKa = 4.75YY25 pKa = 11.02VEE27 pKa = 5.61DD28 pKa = 3.88NLDD31 pKa = 4.16DD32 pKa = 4.16YY33 pKa = 11.37PVYY36 pKa = 10.4NTDD39 pKa = 3.15IQNLSDD45 pKa = 5.22PIRR48 pKa = 11.84EE49 pKa = 3.96ILEE52 pKa = 4.03KK53 pKa = 10.44GGYY56 pKa = 6.94MM57 pKa = 4.6
MM1 pKa = 7.54TSPIKK6 pKa = 9.82LTPQEE11 pKa = 3.91MDD13 pKa = 3.45MLLKK17 pKa = 10.74DD18 pKa = 2.96IATQIEE24 pKa = 4.75YY25 pKa = 11.02VEE27 pKa = 5.61DD28 pKa = 3.88NLDD31 pKa = 4.16DD32 pKa = 4.16YY33 pKa = 11.37PVYY36 pKa = 10.4NTDD39 pKa = 3.15IQNLSDD45 pKa = 5.22PIRR48 pKa = 11.84EE49 pKa = 3.96ILEE52 pKa = 4.03KK53 pKa = 10.44GGYY56 pKa = 6.94MM57 pKa = 4.6
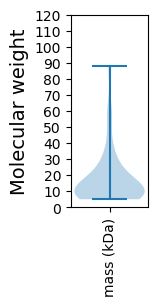
Molecular weight: 6.62 kDa
Isoelectric point according different methods:
Protein with the highest isoelectric point:
>tr|A0A0N9BBD8|A0A0N9BBD8_9CAUD Uncharacterized protein OS=Lactococcus phage GE1 OX=1698369 PE=4 SV=1
MM1 pKa = 7.99KK2 pKa = 8.88YY3 pKa = 8.52TLYY6 pKa = 10.73RR7 pKa = 11.84RR8 pKa = 11.84FDD10 pKa = 3.23GTYY13 pKa = 7.89TLLRR17 pKa = 11.84TRR19 pKa = 11.84EE20 pKa = 3.75AWDD23 pKa = 3.45NVLTPIVRR31 pKa = 11.84SNSKK35 pKa = 10.02EE36 pKa = 3.96AILMITEE43 pKa = 4.05DD44 pKa = 3.14VRR46 pKa = 11.84RR47 pKa = 11.84RR48 pKa = 11.84LEE50 pKa = 3.66
MM1 pKa = 7.99KK2 pKa = 8.88YY3 pKa = 8.52TLYY6 pKa = 10.73RR7 pKa = 11.84RR8 pKa = 11.84FDD10 pKa = 3.23GTYY13 pKa = 7.89TLLRR17 pKa = 11.84TRR19 pKa = 11.84EE20 pKa = 3.75AWDD23 pKa = 3.45NVLTPIVRR31 pKa = 11.84SNSKK35 pKa = 10.02EE36 pKa = 3.96AILMITEE43 pKa = 4.05DD44 pKa = 3.14VRR46 pKa = 11.84RR47 pKa = 11.84RR48 pKa = 11.84LEE50 pKa = 3.66
Molecular weight: 6.09 kDa
Isoelectric point according different methods:
Peptides (in silico digests for buttom-up proteomics)
Below you can find in silico digests of the whole proteome with Trypsin, Chymotrypsin, Trypsin+LysC, LysN, ArgC proteases suitable for different mass spec machines.| Try ESI |
 |
|---|
| ChTry ESI |
|
|---|
| ArgC ESI |
|
|---|
| LysN ESI |
|
|---|
| TryLysC ESI |
|
|---|
| Try MALDI |
|
|---|
| ChTry MALDI |
|
|---|
| ArgC MALDI |
|
|---|
| LysN MALDI |
|
|---|
| TryLysC MALDI |
|
|---|
| Try LTQ |
|
|---|
| ChTry LTQ |
|
|---|
| ArgC LTQ |
|
|---|
| LysN LTQ |
|
|---|
| TryLysC LTQ |
|
|---|
| Try MSlow |
|
|---|
| ChTry MSlow |
|
|---|
| ArgC MSlow |
|
|---|
| LysN MSlow |
|
|---|
| TryLysC MSlow |
|
|---|
| Try MShigh |
|
|---|
| ChTry MShigh |
|
|---|
| ArgC MShigh |
|
|---|
| LysN MShigh |
|
|---|
| TryLysC MShigh |
|
|---|
General Statistics
Number of major isoforms |
Number of additional isoforms |
Number of all proteins |
Number of amino acids |
Min. Seq. Length |
Max. Seq. Length |
Avg. Seq. Length |
Avg. Mol. Weight |
|---|---|---|---|---|---|---|---|
0 |
7339 |
44 |
839 |
152.9 |
17.28 |
Amino acid frequency
Ala |
Cys |
Asp |
Glu |
Phe |
Gly |
His |
Ile |
Lys |
Leu |
|---|---|---|---|---|---|---|---|---|---|
6.513 ± 0.631 | 0.559 ± 0.18 |
6.023 ± 0.264 | 7.194 ± 0.569 |
4.088 ± 0.293 | 6.908 ± 0.691 |
1.185 ± 0.164 | 6.677 ± 0.278 |
8.775 ± 0.441 | 7.957 ± 0.438 |
Met |
Asn |
Gln |
Pro |
Arg |
Ser |
Thr |
Val |
Trp |
Tyr |
|---|---|---|---|---|---|---|---|---|---|
3.338 ± 0.219 | 5.668 ± 0.259 |
2.807 ± 0.301 | 3.733 ± 0.286 |
4.06 ± 0.375 | 6.363 ± 0.437 |
6.009 ± 0.343 | 6.758 ± 0.34 |
1.131 ± 0.145 | 4.251 ± 0.528 |
Most of the basic statistics you can see at this page can be downloaded from this CSV file
See this proteome in:

Proteome-pI is available under Creative Commons Attribution-NoDerivs license, for more details see here
| Reference: Kozlowski LP. Proteome-pI 2.0: Proteome Isoelectric Point Database Update. Nucleic Acids Res. 2021, doi: 10.1093/nar/gkab944 | Contact: Lukasz P. Kozlowski |