Torque teno equus virus 1
Taxonomy: Viruses; Anelloviridae; Mutorquevirus; Torque teno equid virus 1
Average proteome isoelectric point is 7.7
Get precalculated fractions of proteins
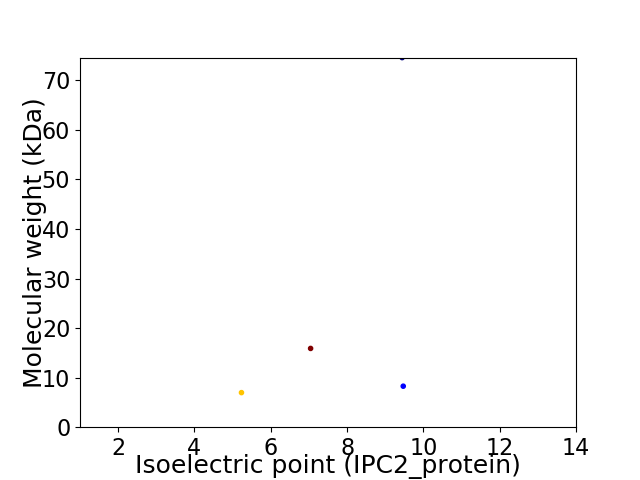
Virtual 2D-PAGE plot for 4 proteins (isoelectric point calculated using IPC2_protein)
Get csv file with sequences according to given criteria:
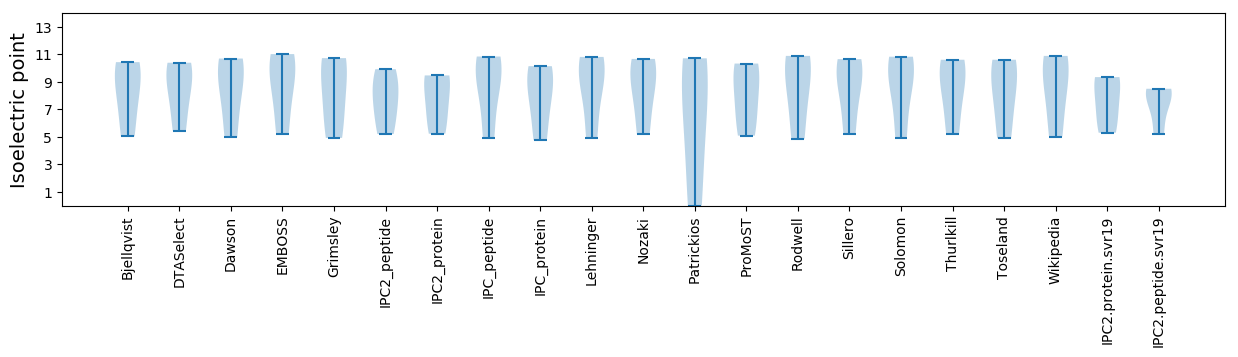
* You can choose from 21 different methods for calculating isoelectric point
Summary statistics related to proteome-wise predictions
Protein with the lowest isoelectric point:
>tr|A0A0H4AQ58|A0A0H4AQ58_9VIRU Capsid protein OS=Torque teno equus virus 1 OX=1673633 PE=3 SV=1
MM1 pKa = 7.61SYY3 pKa = 10.86DD4 pKa = 3.49IVSSMDD10 pKa = 3.22GGSSQSSAMVVLAQNGPHH28 pKa = 6.27LTCCLGSVYY37 pKa = 10.81SAFCTSAFGCVGLSPVSHH55 pKa = 6.44MPLVSSAVMTLATQQ69 pKa = 3.73
MM1 pKa = 7.61SYY3 pKa = 10.86DD4 pKa = 3.49IVSSMDD10 pKa = 3.22GGSSQSSAMVVLAQNGPHH28 pKa = 6.27LTCCLGSVYY37 pKa = 10.81SAFCTSAFGCVGLSPVSHH55 pKa = 6.44MPLVSSAVMTLATQQ69 pKa = 3.73
Molecular weight: 6.98 kDa
Isoelectric point according different methods:
Protein with the highest isoelectric point:
>tr|A0A0H4AQY9|A0A0H4AQY9_9VIRU Uncharacterized protein OS=Torque teno equus virus 1 OX=1673633 PE=4 SV=1
MM1 pKa = 7.81SDD3 pKa = 3.51PKK5 pKa = 11.2SFLDD9 pKa = 3.3LRR11 pKa = 11.84RR12 pKa = 11.84GHH14 pKa = 6.33RR15 pKa = 11.84FKK17 pKa = 11.33NLAHH21 pKa = 7.08PSGSGCPSCPLTPRR35 pKa = 11.84ASLRR39 pKa = 11.84SGTRR43 pKa = 11.84PAGDD47 pKa = 3.35IKK49 pKa = 10.85RR50 pKa = 11.84SACLRR55 pKa = 11.84LGFAPPTLGSVTALFLSLLCFYY77 pKa = 11.32
MM1 pKa = 7.81SDD3 pKa = 3.51PKK5 pKa = 11.2SFLDD9 pKa = 3.3LRR11 pKa = 11.84RR12 pKa = 11.84GHH14 pKa = 6.33RR15 pKa = 11.84FKK17 pKa = 11.33NLAHH21 pKa = 7.08PSGSGCPSCPLTPRR35 pKa = 11.84ASLRR39 pKa = 11.84SGTRR43 pKa = 11.84PAGDD47 pKa = 3.35IKK49 pKa = 10.85RR50 pKa = 11.84SACLRR55 pKa = 11.84LGFAPPTLGSVTALFLSLLCFYY77 pKa = 11.32
Molecular weight: 8.28 kDa
Isoelectric point according different methods:
Peptides (in silico digests for buttom-up proteomics)
Below you can find in silico digests of the whole proteome with Trypsin, Chymotrypsin, Trypsin+LysC, LysN, ArgC proteases suitable for different mass spec machines.| Try ESI |
 |
|---|
| ChTry ESI |
|
|---|
| ArgC ESI |
|
|---|
| LysN ESI |
|
|---|
| TryLysC ESI |
|
|---|
| Try MALDI |
|
|---|
| ChTry MALDI |
|
|---|
| ArgC MALDI |
|
|---|
| LysN MALDI |
|
|---|
| TryLysC MALDI |
|
|---|
| Try LTQ |
|
|---|
| ChTry LTQ |
|
|---|
| ArgC LTQ |
|
|---|
| LysN LTQ |
|
|---|
| TryLysC LTQ |
|
|---|
| Try MSlow |
|
|---|
| ChTry MSlow |
|
|---|
| ArgC MSlow |
|
|---|
| LysN MSlow |
|
|---|
| TryLysC MSlow |
|
|---|
| Try MShigh |
|
|---|
| ChTry MShigh |
|
|---|
| ArgC MShigh |
|
|---|
| LysN MShigh |
|
|---|
| TryLysC MShigh |
|
|---|
General Statistics
Number of major isoforms |
Number of additional isoforms |
Number of all proteins |
Number of amino acids |
Min. Seq. Length |
Max. Seq. Length |
Avg. Seq. Length |
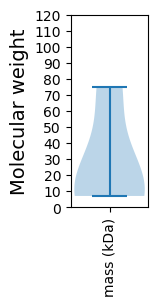
Avg. Mol. Weight |
|---|---|---|---|---|---|---|---|
0 |
919 |
69 |
635 |
229.8 |
26.44 |
Amino acid frequency
Ala |
Cys |
Asp |
Glu |
Phe |
Gly |
His |
Ile |
Lys |
Leu |
|---|---|---|---|---|---|---|---|---|---|
5.114 ± 0.786 | 1.741 ± 0.958 |
5.332 ± 0.512 | 4.57 ± 1.292 |
2.829 ± 0.587 | 7.291 ± 1.177 |
2.176 ± 0.385 | 3.7 ± 0.96 |
6.746 ± 1.274 | 6.638 ± 1.939 |
Met |
Asn |
Gln |
Pro |
Arg |
Ser |
Thr |
Val |
Trp |
Tyr |
|---|---|---|---|---|---|---|---|---|---|
2.176 ± 0.803 | 3.7 ± 0.657 |
5.55 ± 0.804 | 4.461 ± 1.216 |
8.923 ± 1.936 | 8.379 ± 2.672 |
8.052 ± 0.963 | 4.897 ± 1.223 |
3.7 ± 1.175 | 4.026 ± 1.325 |
Most of the basic statistics you can see at this page can be downloaded from this CSV file
See this proteome in:

Proteome-pI is available under Creative Commons Attribution-NoDerivs license, for more details see here
| Reference: Kozlowski LP. Proteome-pI 2.0: Proteome Isoelectric Point Database Update. Nucleic Acids Res. 2021, doi: 10.1093/nar/gkab944 | Contact: Lukasz P. Kozlowski |