Enterococcus phage phiFL1A
Taxonomy: Viruses; Duplodnaviria; Heunggongvirae; Uroviricota; Caudoviricetes; Caudovirales; Siphoviridae; Phifelvirus; Enterococcus virus FL1
Average proteome isoelectric point is 6.42
Get precalculated fractions of proteins
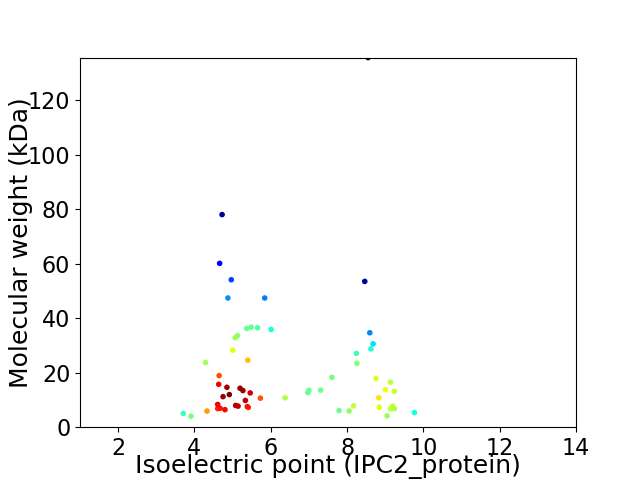
Virtual 2D-PAGE plot for 61 proteins (isoelectric point calculated using IPC2_protein)
Get csv file with sequences according to given criteria:
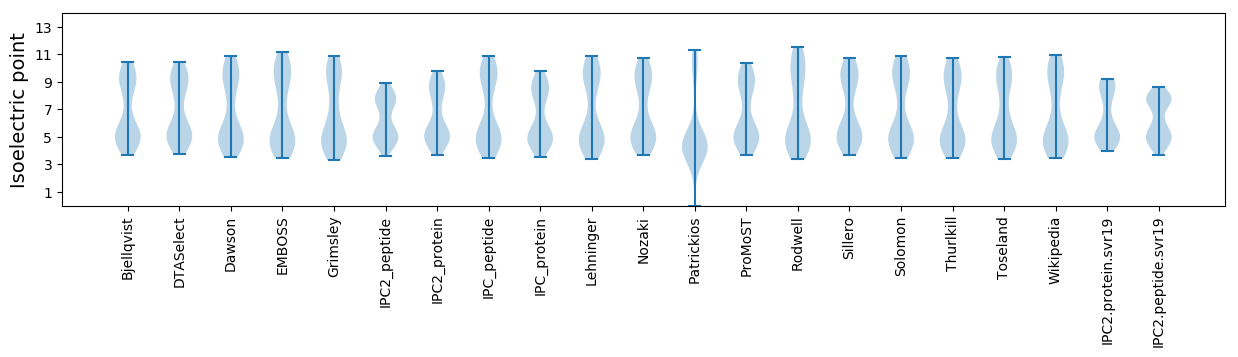
* You can choose from 21 different methods for calculating isoelectric point
Summary statistics related to proteome-wise predictions
Protein with the lowest isoelectric point:
>tr|D2IYV1|D2IYV1_9CAUD Uncharacterized protein gp29 OS=Enterococcus phage phiFL1A OX=673832 GN=gp29 PE=4 SV=1
MM1 pKa = 7.72GEE3 pKa = 3.9IAEE6 pKa = 4.25MMLEE10 pKa = 4.23GVLCASCGVFLDD22 pKa = 3.84VDD24 pKa = 3.93GNGYY28 pKa = 9.46PEE30 pKa = 4.14YY31 pKa = 11.06CEE33 pKa = 5.4DD34 pKa = 3.74CQEE37 pKa = 4.13QIIEE41 pKa = 4.03EE42 pKa = 4.18DD43 pKa = 3.31HH44 pKa = 6.38RR45 pKa = 5.97
MM1 pKa = 7.72GEE3 pKa = 3.9IAEE6 pKa = 4.25MMLEE10 pKa = 4.23GVLCASCGVFLDD22 pKa = 3.84VDD24 pKa = 3.93GNGYY28 pKa = 9.46PEE30 pKa = 4.14YY31 pKa = 11.06CEE33 pKa = 5.4DD34 pKa = 3.74CQEE37 pKa = 4.13QIIEE41 pKa = 4.03EE42 pKa = 4.18DD43 pKa = 3.31HH44 pKa = 6.38RR45 pKa = 5.97
Molecular weight: 5.04 kDa
Isoelectric point according different methods:
Protein with the highest isoelectric point:
>tr|D2IYU5|D2IYU5_9CAUD Uncharacterized protein gp23 OS=Enterococcus phage phiFL1A OX=673832 GN=gp23 PE=4 SV=1
MM1 pKa = 7.71GKK3 pKa = 7.96TKK5 pKa = 10.86SKK7 pKa = 10.16IKK9 pKa = 9.94KK10 pKa = 8.47KK11 pKa = 10.21KK12 pKa = 9.61RR13 pKa = 11.84RR14 pKa = 11.84LKK16 pKa = 10.48EE17 pKa = 3.45KK18 pKa = 10.44AIANGTYY25 pKa = 10.09SKK27 pKa = 10.47RR28 pKa = 11.84GKK30 pKa = 10.12SDD32 pKa = 2.59GMYY35 pKa = 10.88KK36 pKa = 8.91MQGTDD41 pKa = 2.94DD42 pKa = 4.13CLGKK46 pKa = 10.45RR47 pKa = 3.97
MM1 pKa = 7.71GKK3 pKa = 7.96TKK5 pKa = 10.86SKK7 pKa = 10.16IKK9 pKa = 9.94KK10 pKa = 8.47KK11 pKa = 10.21KK12 pKa = 9.61RR13 pKa = 11.84RR14 pKa = 11.84LKK16 pKa = 10.48EE17 pKa = 3.45KK18 pKa = 10.44AIANGTYY25 pKa = 10.09SKK27 pKa = 10.47RR28 pKa = 11.84GKK30 pKa = 10.12SDD32 pKa = 2.59GMYY35 pKa = 10.88KK36 pKa = 8.91MQGTDD41 pKa = 2.94DD42 pKa = 4.13CLGKK46 pKa = 10.45RR47 pKa = 3.97
Molecular weight: 5.35 kDa
Isoelectric point according different methods:
Peptides (in silico digests for buttom-up proteomics)
Below you can find in silico digests of the whole proteome with Trypsin, Chymotrypsin, Trypsin+LysC, LysN, ArgC proteases suitable for different mass spec machines.| Try ESI |
 |
|---|
| ChTry ESI |
|
|---|
| ArgC ESI |
|
|---|
| LysN ESI |
|
|---|
| TryLysC ESI |
|
|---|
| Try MALDI |
|
|---|
| ChTry MALDI |
|
|---|
| ArgC MALDI |
|
|---|
| LysN MALDI |
|
|---|
| TryLysC MALDI |
|
|---|
| Try LTQ |
|
|---|
| ChTry LTQ |
|
|---|
| ArgC LTQ |
|
|---|
| LysN LTQ |
|
|---|
| TryLysC LTQ |
|
|---|
| Try MSlow |
|
|---|
| ChTry MSlow |
|
|---|
| ArgC MSlow |
|
|---|
| LysN MSlow |
|
|---|
| TryLysC MSlow |
|
|---|
| Try MShigh |
|
|---|
| ChTry MShigh |
|
|---|
| ArgC MShigh |
|
|---|
| LysN MShigh |
|
|---|
| TryLysC MShigh |
|
|---|
General Statistics
Number of major isoforms |
Number of additional isoforms |
Number of all proteins |
Number of amino acids |
Min. Seq. Length |
Max. Seq. Length |
Avg. Seq. Length |
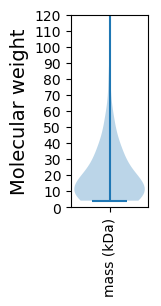
Avg. Mol. Weight |
|---|---|---|---|---|---|---|---|
0 |
11623 |
33 |
1304 |
190.5 |
21.58 |
Amino acid frequency
Ala |
Cys |
Asp |
Glu |
Phe |
Gly |
His |
Ile |
Lys |
Leu |
|---|---|---|---|---|---|---|---|---|---|
6.427 ± 0.536 | 0.74 ± 0.119 |
5.928 ± 0.384 | 7.717 ± 0.624 |
3.906 ± 0.269 | 6.169 ± 0.368 |
1.093 ± 0.136 | 7.158 ± 0.303 |
8.896 ± 0.516 | 8.346 ± 0.311 |
Met |
Asn |
Gln |
Pro |
Arg |
Ser |
Thr |
Val |
Trp |
Tyr |
|---|---|---|---|---|---|---|---|---|---|
2.65 ± 0.289 | 6.642 ± 0.386 |
2.693 ± 0.197 | 4.156 ± 0.251 |
3.88 ± 0.411 | 6.479 ± 0.617 |
5.954 ± 0.4 | 6.066 ± 0.219 |
1.144 ± 0.128 | 3.958 ± 0.45 |
Most of the basic statistics you can see at this page can be downloaded from this CSV file
See this proteome in:

Proteome-pI is available under Creative Commons Attribution-NoDerivs license, for more details see here
| Reference: Kozlowski LP. Proteome-pI 2.0: Proteome Isoelectric Point Database Update. Nucleic Acids Res. 2021, doi: 10.1093/nar/gkab944 | Contact: Lukasz P. Kozlowski |