Escherichia phage HZ2R8
Taxonomy: Viruses; Duplodnaviria; Heunggongvirae; Uroviricota; Caudoviricetes; Caudovirales; Autographiviridae; Studiervirinae; Teseptimavirus; Escherichia virus HZ2R8
Average proteome isoelectric point is 6.26
Get precalculated fractions of proteins
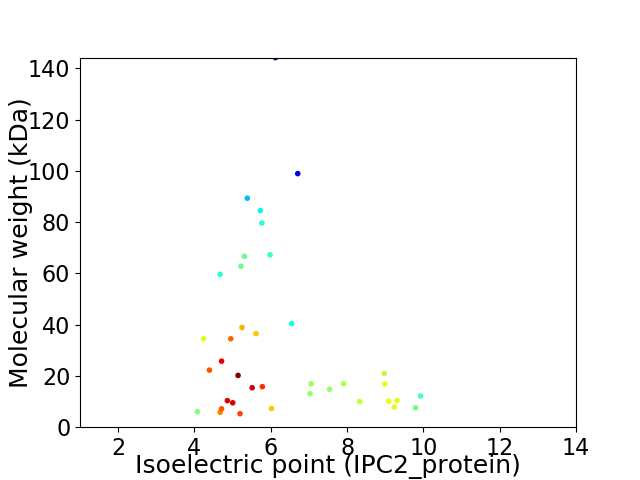
Virtual 2D-PAGE plot for 38 proteins (isoelectric point calculated using IPC2_protein)
Get csv file with sequences according to given criteria:
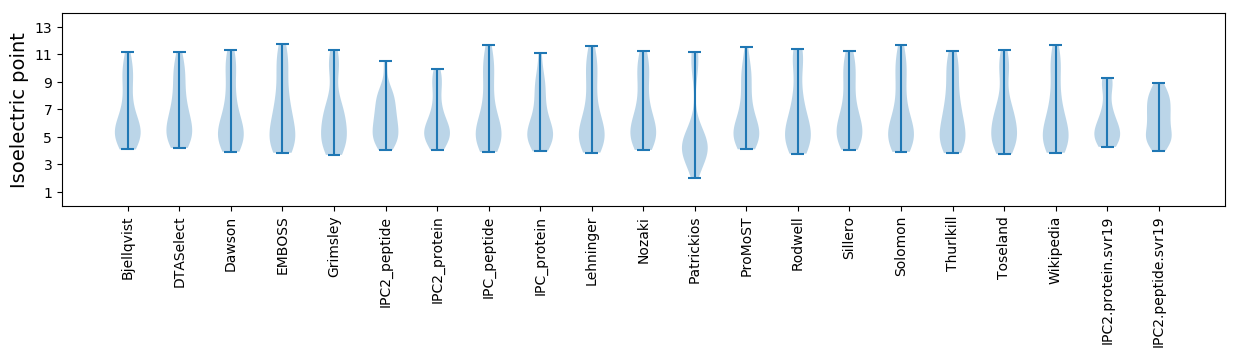
* You can choose from 21 different methods for calculating isoelectric point
Summary statistics related to proteome-wise predictions
Protein with the lowest isoelectric point:
>tr|A0A2K9VJZ6|A0A2K9VJZ6_9CAUD Tail fiber protein OS=Escherichia phage HZ2R8 OX=2079317 GN=HZ2R8_38 PE=4 SV=1
MM1 pKa = 7.72ANNTTQYY8 pKa = 11.35GLTAQTVLFYY18 pKa = 11.2SDD20 pKa = 3.48MVRR23 pKa = 11.84CGFDD27 pKa = 2.5WSLAMEE33 pKa = 4.58HH34 pKa = 6.59LKK36 pKa = 10.47EE37 pKa = 4.34LYY39 pKa = 10.14EE40 pKa = 4.08NNKK43 pKa = 10.29AIALEE48 pKa = 4.19SAEE51 pKa = 4.07
MM1 pKa = 7.72ANNTTQYY8 pKa = 11.35GLTAQTVLFYY18 pKa = 11.2SDD20 pKa = 3.48MVRR23 pKa = 11.84CGFDD27 pKa = 2.5WSLAMEE33 pKa = 4.58HH34 pKa = 6.59LKK36 pKa = 10.47EE37 pKa = 4.34LYY39 pKa = 10.14EE40 pKa = 4.08NNKK43 pKa = 10.29AIALEE48 pKa = 4.19SAEE51 pKa = 4.07
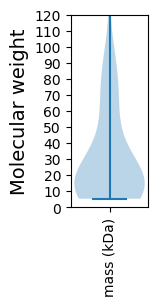
Molecular weight: 5.82 kDa
Isoelectric point according different methods:
Protein with the highest isoelectric point:
>tr|A0A2K9VK00|A0A2K9VK00_9CAUD DNA primase/helicase OS=Escherichia phage HZ2R8 OX=2079317 GN=HZ2R8_16 PE=4 SV=1
MM1 pKa = 7.29VRR3 pKa = 11.84RR4 pKa = 11.84LRR6 pKa = 11.84LWTEE10 pKa = 3.79RR11 pKa = 11.84CSFRR15 pKa = 11.84PLLTAQTVLLLLLYY29 pKa = 10.5VKK31 pKa = 10.48DD32 pKa = 3.24SAMPSRR38 pKa = 11.84RR39 pKa = 11.84CSKK42 pKa = 7.74RR43 pKa = 11.84WMMRR47 pKa = 11.84PCSKK51 pKa = 10.36HH52 pKa = 5.09PQPLYY57 pKa = 10.78GRR59 pKa = 11.84CSDD62 pKa = 3.57VV63 pKa = 2.95
MM1 pKa = 7.29VRR3 pKa = 11.84RR4 pKa = 11.84LRR6 pKa = 11.84LWTEE10 pKa = 3.79RR11 pKa = 11.84CSFRR15 pKa = 11.84PLLTAQTVLLLLLYY29 pKa = 10.5VKK31 pKa = 10.48DD32 pKa = 3.24SAMPSRR38 pKa = 11.84RR39 pKa = 11.84CSKK42 pKa = 7.74RR43 pKa = 11.84WMMRR47 pKa = 11.84PCSKK51 pKa = 10.36HH52 pKa = 5.09PQPLYY57 pKa = 10.78GRR59 pKa = 11.84CSDD62 pKa = 3.57VV63 pKa = 2.95
Molecular weight: 7.54 kDa
Isoelectric point according different methods:
Peptides (in silico digests for buttom-up proteomics)
Below you can find in silico digests of the whole proteome with Trypsin, Chymotrypsin, Trypsin+LysC, LysN, ArgC proteases suitable for different mass spec machines.| Try ESI |
 |
|---|
| ChTry ESI |
|
|---|
| ArgC ESI |
|
|---|
| LysN ESI |
|
|---|
| TryLysC ESI |
|
|---|
| Try MALDI |
|
|---|
| ChTry MALDI |
|
|---|
| ArgC MALDI |
|
|---|
| LysN MALDI |
|
|---|
| TryLysC MALDI |
|
|---|
| Try LTQ |
|
|---|
| ChTry LTQ |
|
|---|
| ArgC LTQ |
|
|---|
| LysN LTQ |
|
|---|
| TryLysC LTQ |
|
|---|
| Try MSlow |
|
|---|
| ChTry MSlow |
|
|---|
| ArgC MSlow |
|
|---|
| LysN MSlow |
|
|---|
| TryLysC MSlow |
|
|---|
| Try MShigh |
|
|---|
| ChTry MShigh |
|
|---|
| ArgC MShigh |
|
|---|
| LysN MShigh |
|
|---|
| TryLysC MShigh |
|
|---|
General Statistics
Number of major isoforms |
Number of additional isoforms |
Number of all proteins |
Number of amino acids |
Min. Seq. Length |
Max. Seq. Length |
Avg. Seq. Length |
Avg. Mol. Weight |
|---|---|---|---|---|---|---|---|
0 |
11149 |
51 |
1318 |
293.4 |
32.79 |
Amino acid frequency
Ala |
Cys |
Asp |
Glu |
Phe |
Gly |
His |
Ile |
Lys |
Leu |
|---|---|---|---|---|---|---|---|---|---|
9.283 ± 0.456 | 1.139 ± 0.193 |
6.413 ± 0.238 | 7.364 ± 0.397 |
3.444 ± 0.208 | 7.364 ± 0.309 |
1.875 ± 0.214 | 5.265 ± 0.179 |
6.494 ± 0.371 | 8.037 ± 0.278 |
Met |
Asn |
Gln |
Pro |
Arg |
Ser |
Thr |
Val |
Trp |
Tyr |
|---|---|---|---|---|---|---|---|---|---|
3.041 ± 0.192 | 4.61 ± 0.35 |
3.57 ± 0.187 | 3.839 ± 0.324 |
5.848 ± 0.232 | 5.947 ± 0.299 |
5.418 ± 0.199 | 6.225 ± 0.232 |
1.525 ± 0.154 | 3.301 ± 0.187 |
Most of the basic statistics you can see at this page can be downloaded from this CSV file
See this proteome in:

Proteome-pI is available under Creative Commons Attribution-NoDerivs license, for more details see here
| Reference: Kozlowski LP. Proteome-pI 2.0: Proteome Isoelectric Point Database Update. Nucleic Acids Res. 2021, doi: 10.1093/nar/gkab944 | Contact: Lukasz P. Kozlowski |