Pseudomonas brassicae
Taxonomy: cellular organisms; Bacteria; Proteobacteria; Gammaproteobacteria; Pseudomonadales; Pseudomonadaceae; Pseudomonas
Average proteome isoelectric point is 6.54
Get precalculated fractions of proteins
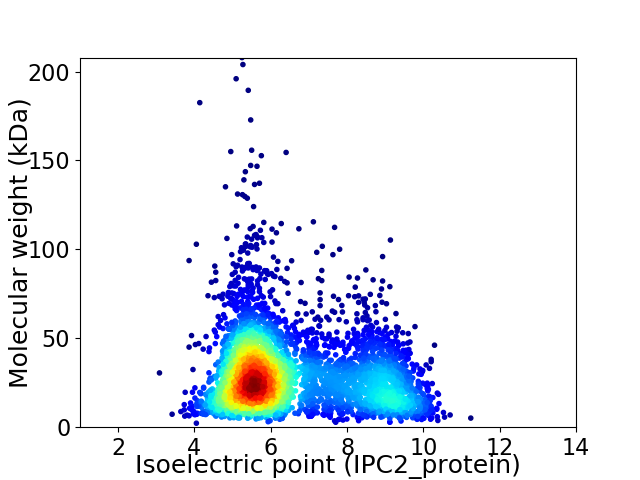
Virtual 2D-PAGE plot for 4227 proteins (isoelectric point calculated using IPC2_protein)
Get csv file with sequences according to given criteria:
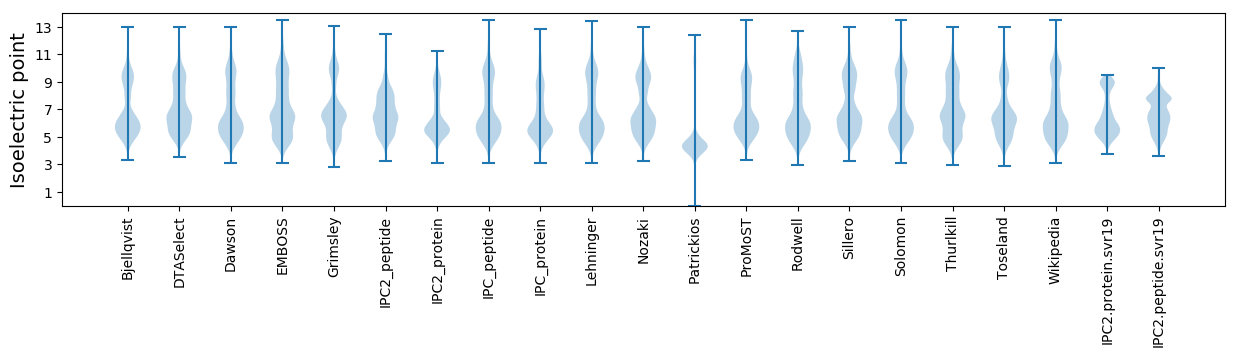
* You can choose from 21 different methods for calculating isoelectric point
Summary statistics related to proteome-wise predictions
Protein with the lowest isoelectric point:
>tr|A0A6B3P341|A0A6B3P341_9PSED Amidophosphoribosyltransferase OS=Pseudomonas brassicae OX=2708063 GN=purF PE=3 SV=1
SS1 pKa = 6.87SFLGGALQTAAGVAGGVMLAQGISSLFNHH30 pKa = 6.87HH31 pKa = 6.74SSPPQEE37 pKa = 3.89VTEE40 pKa = 4.86VINEE44 pKa = 4.18APTPAADD51 pKa = 4.05SGWGGNQEE59 pKa = 4.36QRR61 pKa = 11.84LTADD65 pKa = 2.97NGGYY69 pKa = 9.49SQDD72 pKa = 3.24QGGFTDD78 pKa = 2.86THH80 pKa = 6.33YY81 pKa = 11.59ADD83 pKa = 4.85DD84 pKa = 4.57GGGFFADD91 pKa = 4.23DD92 pKa = 3.86DD93 pKa = 4.58AFVV96 pKa = 3.36
SS1 pKa = 6.87SFLGGALQTAAGVAGGVMLAQGISSLFNHH30 pKa = 6.87HH31 pKa = 6.74SSPPQEE37 pKa = 3.89VTEE40 pKa = 4.86VINEE44 pKa = 4.18APTPAADD51 pKa = 4.05SGWGGNQEE59 pKa = 4.36QRR61 pKa = 11.84LTADD65 pKa = 2.97NGGYY69 pKa = 9.49SQDD72 pKa = 3.24QGGFTDD78 pKa = 2.86THH80 pKa = 6.33YY81 pKa = 11.59ADD83 pKa = 4.85DD84 pKa = 4.57GGGFFADD91 pKa = 4.23DD92 pKa = 3.86DD93 pKa = 4.58AFVV96 pKa = 3.36
Molecular weight: 9.76 kDa
Isoelectric point according different methods:
Protein with the highest isoelectric point:
>tr|A0A6B3NR57|A0A6B3NR57_9PSED DUF2059 domain-containing protein OS=Pseudomonas brassicae OX=2708063 GN=G3435_05040 PE=4 SV=1
MM1 pKa = 7.45KK2 pKa = 9.56RR3 pKa = 11.84TFQPSTIKK11 pKa = 10.52RR12 pKa = 11.84ARR14 pKa = 11.84THH16 pKa = 5.94GFRR19 pKa = 11.84ARR21 pKa = 11.84MATKK25 pKa = 10.16NGRR28 pKa = 11.84AVLSRR33 pKa = 11.84RR34 pKa = 11.84RR35 pKa = 11.84AKK37 pKa = 9.94GRR39 pKa = 11.84KK40 pKa = 8.66RR41 pKa = 11.84LAVV44 pKa = 3.41
MM1 pKa = 7.45KK2 pKa = 9.56RR3 pKa = 11.84TFQPSTIKK11 pKa = 10.52RR12 pKa = 11.84ARR14 pKa = 11.84THH16 pKa = 5.94GFRR19 pKa = 11.84ARR21 pKa = 11.84MATKK25 pKa = 10.16NGRR28 pKa = 11.84AVLSRR33 pKa = 11.84RR34 pKa = 11.84RR35 pKa = 11.84AKK37 pKa = 9.94GRR39 pKa = 11.84KK40 pKa = 8.66RR41 pKa = 11.84LAVV44 pKa = 3.41
Molecular weight: 5.12 kDa
Isoelectric point according different methods:
Peptides (in silico digests for buttom-up proteomics)
Below you can find in silico digests of the whole proteome with Trypsin, Chymotrypsin, Trypsin+LysC, LysN, ArgC proteases suitable for different mass spec machines.| Try ESI |
 |
|---|
| ChTry ESI |
|
|---|
| ArgC ESI |
|
|---|
| LysN ESI |
|
|---|
| TryLysC ESI |
|
|---|
| Try MALDI |
|
|---|
| ChTry MALDI |
|
|---|
| ArgC MALDI |
|
|---|
| LysN MALDI |
|
|---|
| TryLysC MALDI |
|
|---|
| Try LTQ |
|
|---|
| ChTry LTQ |
|
|---|
| ArgC LTQ |
|
|---|
| LysN LTQ |
|
|---|
| TryLysC LTQ |
|
|---|
| Try MSlow |
|
|---|
| ChTry MSlow |
|
|---|
| ArgC MSlow |
|
|---|
| LysN MSlow |
|
|---|
| TryLysC MSlow |
|
|---|
| Try MShigh |
|
|---|
| ChTry MShigh |
|
|---|
| ArgC MShigh |
|
|---|
| LysN MShigh |
|
|---|
| TryLysC MShigh |
|
|---|
General Statistics
Number of major isoforms |
Number of additional isoforms |
Number of all proteins |
Number of amino acids |
Min. Seq. Length |
Max. Seq. Length |
Avg. Seq. Length |
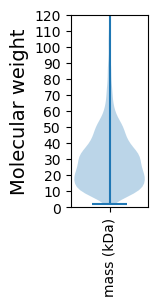
Avg. Mol. Weight |
|---|---|---|---|---|---|---|---|
0 |
1204593 |
21 |
1934 |
285.0 |
31.21 |
Amino acid frequency
Ala |
Cys |
Asp |
Glu |
Phe |
Gly |
His |
Ile |
Lys |
Leu |
|---|---|---|---|---|---|---|---|---|---|
11.457 ± 0.049 | 1.052 ± 0.013 |
5.269 ± 0.027 | 5.371 ± 0.037 |
3.562 ± 0.026 | 7.96 ± 0.038 |
2.402 ± 0.021 | 4.477 ± 0.033 |
3.162 ± 0.032 | 11.99 ± 0.058 |
Met |
Asn |
Gln |
Pro |
Arg |
Ser |
Thr |
Val |
Trp |
Tyr |
|---|---|---|---|---|---|---|---|---|---|
2.246 ± 0.019 | 2.903 ± 0.024 |
4.821 ± 0.029 | 4.876 ± 0.034 |
6.586 ± 0.037 | 5.789 ± 0.034 |
4.795 ± 0.029 | 7.244 ± 0.033 |
1.459 ± 0.017 | 2.58 ± 0.021 |
Most of the basic statistics you can see at this page can be downloaded from this CSV file
See this proteome in:

Proteome-pI is available under Creative Commons Attribution-NoDerivs license, for more details see here
| Reference: Kozlowski LP. Proteome-pI 2.0: Proteome Isoelectric Point Database Update. Nucleic Acids Res. 2021, doi: 10.1093/nar/gkab944 | Contact: Lukasz P. Kozlowski |