Mycobacterium phage Bruin
Taxonomy: Viruses; Duplodnaviria; Heunggongvirae; Uroviricota; Caudoviricetes; Caudovirales; Siphoviridae; Kostyavirus; unclassified Kostyavirus
Average proteome isoelectric point is 6.06
Get precalculated fractions of proteins
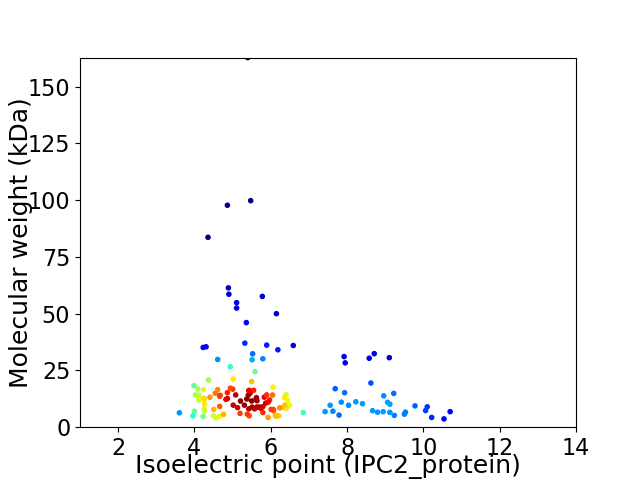
Virtual 2D-PAGE plot for 141 proteins (isoelectric point calculated using IPC2_protein)
Get csv file with sequences according to given criteria:
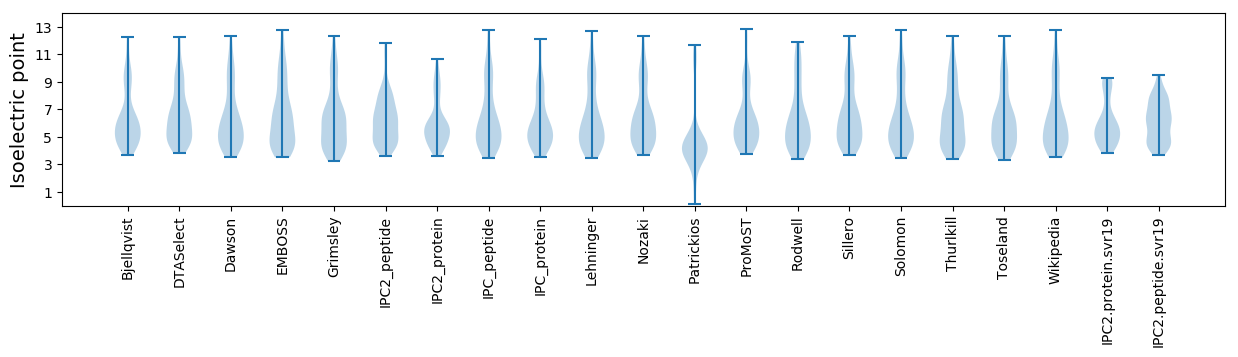
* You can choose from 21 different methods for calculating isoelectric point
Summary statistics related to proteome-wise predictions
Protein with the lowest isoelectric point:
>tr|V5R793|V5R793_9CAUD Uncharacterized protein OS=Mycobacterium phage Bruin OX=1391179 GN=34 PE=4 SV=1
MM1 pKa = 7.61AAGPWTPVNSTRR13 pKa = 11.84TNLLNGTFDD22 pKa = 4.73LDD24 pKa = 3.61SDD26 pKa = 4.18SFKK29 pKa = 11.13VALVTSSGNISASTTAWSGVTGEE52 pKa = 4.21VASGNGYY59 pKa = 5.63TTGGEE64 pKa = 4.43SVTLSLTGTTSVAVTFASNPVWTASGSGIAAKK96 pKa = 9.28WAVIYY101 pKa = 10.04EE102 pKa = 4.11VGGNVLAYY110 pKa = 10.43ALLNSDD116 pKa = 4.33GSTSTTTDD124 pKa = 2.97GNTLTVNSSGANYY137 pKa = 10.03IFTLAA142 pKa = 4.06
MM1 pKa = 7.61AAGPWTPVNSTRR13 pKa = 11.84TNLLNGTFDD22 pKa = 4.73LDD24 pKa = 3.61SDD26 pKa = 4.18SFKK29 pKa = 11.13VALVTSSGNISASTTAWSGVTGEE52 pKa = 4.21VASGNGYY59 pKa = 5.63TTGGEE64 pKa = 4.43SVTLSLTGTTSVAVTFASNPVWTASGSGIAAKK96 pKa = 9.28WAVIYY101 pKa = 10.04EE102 pKa = 4.11VGGNVLAYY110 pKa = 10.43ALLNSDD116 pKa = 4.33GSTSTTTDD124 pKa = 2.97GNTLTVNSSGANYY137 pKa = 10.03IFTLAA142 pKa = 4.06
Molecular weight: 14.22 kDa
Isoelectric point according different methods:
Protein with the highest isoelectric point:
>tr|V5R769|V5R769_9CAUD Uncharacterized protein OS=Mycobacterium phage Bruin OX=1391179 GN=4 PE=4 SV=1
MM1 pKa = 7.3TSASAVSRR9 pKa = 11.84ALNRR13 pKa = 11.84AGVITATTGWNRR25 pKa = 11.84YY26 pKa = 7.52GVFVHH31 pKa = 6.1RR32 pKa = 11.84HH33 pKa = 3.79VDD35 pKa = 3.34GAQININGRR44 pKa = 11.84TDD46 pKa = 3.4EE47 pKa = 4.5EE48 pKa = 4.5VEE50 pKa = 4.13KK51 pKa = 10.66MIDD54 pKa = 3.23RR55 pKa = 11.84VTSEE59 pKa = 5.17LSAQGYY65 pKa = 8.74RR66 pKa = 11.84VNQANARR73 pKa = 11.84TLIVRR78 pKa = 11.84KK79 pKa = 10.03SSSNKK84 pKa = 9.25RR85 pKa = 3.36
MM1 pKa = 7.3TSASAVSRR9 pKa = 11.84ALNRR13 pKa = 11.84AGVITATTGWNRR25 pKa = 11.84YY26 pKa = 7.52GVFVHH31 pKa = 6.1RR32 pKa = 11.84HH33 pKa = 3.79VDD35 pKa = 3.34GAQININGRR44 pKa = 11.84TDD46 pKa = 3.4EE47 pKa = 4.5EE48 pKa = 4.5VEE50 pKa = 4.13KK51 pKa = 10.66MIDD54 pKa = 3.23RR55 pKa = 11.84VTSEE59 pKa = 5.17LSAQGYY65 pKa = 8.74RR66 pKa = 11.84VNQANARR73 pKa = 11.84TLIVRR78 pKa = 11.84KK79 pKa = 10.03SSSNKK84 pKa = 9.25RR85 pKa = 3.36
Molecular weight: 9.39 kDa
Isoelectric point according different methods:
Peptides (in silico digests for buttom-up proteomics)
Below you can find in silico digests of the whole proteome with Trypsin, Chymotrypsin, Trypsin+LysC, LysN, ArgC proteases suitable for different mass spec machines.| Try ESI |
 |
|---|
| ChTry ESI |
|
|---|
| ArgC ESI |
|
|---|
| LysN ESI |
|
|---|
| TryLysC ESI |
|
|---|
| Try MALDI |
|
|---|
| ChTry MALDI |
|
|---|
| ArgC MALDI |
|
|---|
| LysN MALDI |
|
|---|
| TryLysC MALDI |
|
|---|
| Try LTQ |
|
|---|
| ChTry LTQ |
|
|---|
| ArgC LTQ |
|
|---|
| LysN LTQ |
|
|---|
| TryLysC LTQ |
|
|---|
| Try MSlow |
|
|---|
| ChTry MSlow |
|
|---|
| ArgC MSlow |
|
|---|
| LysN MSlow |
|
|---|
| TryLysC MSlow |
|
|---|
| Try MShigh |
|
|---|
| ChTry MShigh |
|
|---|
| ArgC MShigh |
|
|---|
| LysN MShigh |
|
|---|
| TryLysC MShigh |
|
|---|
General Statistics
Number of major isoforms |
Number of additional isoforms |
Number of all proteins |
Number of amino acids |
Min. Seq. Length |
Max. Seq. Length |
Avg. Seq. Length |
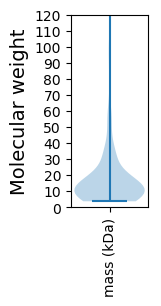
Avg. Mol. Weight |
|---|---|---|---|---|---|---|---|
0 |
23286 |
32 |
1577 |
165.1 |
18.13 |
Amino acid frequency
Ala |
Cys |
Asp |
Glu |
Phe |
Gly |
His |
Ile |
Lys |
Leu |
|---|---|---|---|---|---|---|---|---|---|
10.139 ± 0.4 | 1.267 ± 0.144 |
6.386 ± 0.231 | 6.588 ± 0.24 |
2.959 ± 0.156 | 8.756 ± 0.499 |
2.504 ± 0.161 | 4.475 ± 0.147 |
4.531 ± 0.226 | 8.121 ± 0.215 |
Met |
Asn |
Gln |
Pro |
Arg |
Ser |
Thr |
Val |
Trp |
Tyr |
|---|---|---|---|---|---|---|---|---|---|
2.379 ± 0.113 | 3.427 ± 0.136 |
5.304 ± 0.193 | 3.281 ± 0.203 |
5.926 ± 0.304 | 5.634 ± 0.232 |
6.257 ± 0.274 | 7.094 ± 0.251 |
1.92 ± 0.131 | 3.053 ± 0.152 |
Most of the basic statistics you can see at this page can be downloaded from this CSV file
See this proteome in:

Proteome-pI is available under Creative Commons Attribution-NoDerivs license, for more details see here
| Reference: Kozlowski LP. Proteome-pI 2.0: Proteome Isoelectric Point Database Update. Nucleic Acids Res. 2021, doi: 10.1093/nar/gkab944 | Contact: Lukasz P. Kozlowski |