Tinamus guttatus (White-throated tinamou)
Taxonomy: cellular organisms; Eukaryota; Opisthokonta; Metazoa; Eumetazoa; Bilateria; Deuterostomia; Chordata; Craniata; Vertebrata; Gnathostomata; Teleostomi; Euteleostomi; Sarcopterygii; Dipnotetrapodomorpha; Tetrapoda; Amniota; Sauropsida; Sauria; Archelosauria; Archosauria; Dinosauria; Saurischia; Theropoda;
Average proteome isoelectric point is 6.79
Get precalculated fractions of proteins
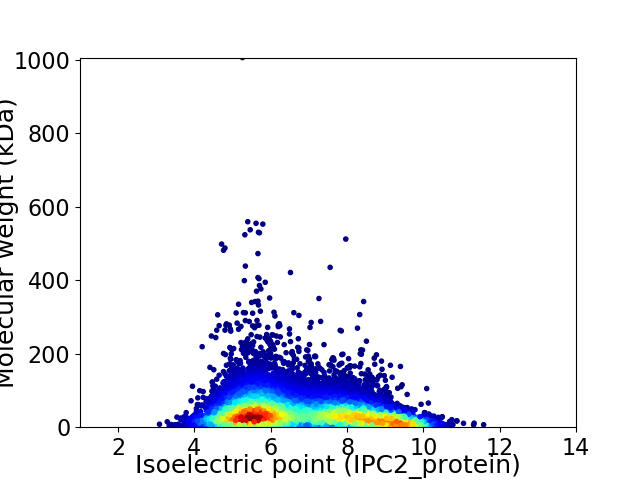
Virtual 2D-PAGE plot for 13377 proteins (isoelectric point calculated using IPC2_protein)
Get csv file with sequences according to given criteria:
* You can choose from 21 different methods for calculating isoelectric point
Summary statistics related to proteome-wise predictions
Protein with the lowest isoelectric point:
>tr|A0A099ZKJ5|A0A099ZKJ5_TINGU Protein MAK16 (Fragment) OS=Tinamus guttatus OX=94827 GN=N309_12231 PE=4 SV=1
SS1 pKa = 6.83RR2 pKa = 11.84LSWLDD7 pKa = 3.18NSGLGFSLDD16 pKa = 3.61YY17 pKa = 9.22PTISLHH23 pKa = 6.36AVSRR27 pKa = 11.84DD28 pKa = 3.07LNAYY32 pKa = 7.9PWEE35 pKa = 4.19HH36 pKa = 6.86LYY38 pKa = 11.74VMVNAKK44 pKa = 10.37FEE46 pKa = 4.14EE47 pKa = 4.88DD48 pKa = 3.52NAKK51 pKa = 9.13EE52 pKa = 3.9APMAEE57 pKa = 4.15GEE59 pKa = 4.26EE60 pKa = 4.27EE61 pKa = 4.29EE62 pKa = 4.35EE63 pKa = 5.91AEE65 pKa = 5.56DD66 pKa = 5.18SDD68 pKa = 6.46DD69 pKa = 3.65DD70 pKa = 4.13TEE72 pKa = 5.23PIAEE76 pKa = 4.12FRR78 pKa = 11.84FVPSDD83 pKa = 3.36KK84 pKa = 10.88SALEE88 pKa = 3.9AMFSAMCEE96 pKa = 4.27CQALHH101 pKa = 7.39PDD103 pKa = 4.25PEE105 pKa = 6.28DD106 pKa = 3.73EE107 pKa = 6.39DD108 pKa = 4.23SDD110 pKa = 3.72NDD112 pKa = 4.0YY113 pKa = 11.37EE114 pKa = 4.59GEE116 pKa = 4.16EE117 pKa = 4.41YY118 pKa = 10.56DD119 pKa = 4.87VEE121 pKa = 4.22AHH123 pKa = 6.63EE124 pKa = 5.44LGQGDD129 pKa = 3.65IPSFYY134 pKa = 9.93TYY136 pKa = 11.03EE137 pKa = 4.17EE138 pKa = 4.58GLSHH142 pKa = 6.9LTAEE146 pKa = 4.71GQATLEE152 pKa = 4.11RR153 pKa = 11.84LEE155 pKa = 4.74GMLAQSVSSQYY166 pKa = 11.66NMAGVRR172 pKa = 11.84TEE174 pKa = 3.7DD175 pKa = 3.58SIRR178 pKa = 11.84EE179 pKa = 4.1FEE181 pKa = 5.41DD182 pKa = 3.49GMEE185 pKa = 4.06VDD187 pKa = 5.01LAPAVAGQFEE197 pKa = 4.53DD198 pKa = 5.38AEE200 pKa = 4.32VDD202 pKa = 3.59HH203 pKa = 7.08
SS1 pKa = 6.83RR2 pKa = 11.84LSWLDD7 pKa = 3.18NSGLGFSLDD16 pKa = 3.61YY17 pKa = 9.22PTISLHH23 pKa = 6.36AVSRR27 pKa = 11.84DD28 pKa = 3.07LNAYY32 pKa = 7.9PWEE35 pKa = 4.19HH36 pKa = 6.86LYY38 pKa = 11.74VMVNAKK44 pKa = 10.37FEE46 pKa = 4.14EE47 pKa = 4.88DD48 pKa = 3.52NAKK51 pKa = 9.13EE52 pKa = 3.9APMAEE57 pKa = 4.15GEE59 pKa = 4.26EE60 pKa = 4.27EE61 pKa = 4.29EE62 pKa = 4.35EE63 pKa = 5.91AEE65 pKa = 5.56DD66 pKa = 5.18SDD68 pKa = 6.46DD69 pKa = 3.65DD70 pKa = 4.13TEE72 pKa = 5.23PIAEE76 pKa = 4.12FRR78 pKa = 11.84FVPSDD83 pKa = 3.36KK84 pKa = 10.88SALEE88 pKa = 3.9AMFSAMCEE96 pKa = 4.27CQALHH101 pKa = 7.39PDD103 pKa = 4.25PEE105 pKa = 6.28DD106 pKa = 3.73EE107 pKa = 6.39DD108 pKa = 4.23SDD110 pKa = 3.72NDD112 pKa = 4.0YY113 pKa = 11.37EE114 pKa = 4.59GEE116 pKa = 4.16EE117 pKa = 4.41YY118 pKa = 10.56DD119 pKa = 4.87VEE121 pKa = 4.22AHH123 pKa = 6.63EE124 pKa = 5.44LGQGDD129 pKa = 3.65IPSFYY134 pKa = 9.93TYY136 pKa = 11.03EE137 pKa = 4.17EE138 pKa = 4.58GLSHH142 pKa = 6.9LTAEE146 pKa = 4.71GQATLEE152 pKa = 4.11RR153 pKa = 11.84LEE155 pKa = 4.74GMLAQSVSSQYY166 pKa = 11.66NMAGVRR172 pKa = 11.84TEE174 pKa = 3.7DD175 pKa = 3.58SIRR178 pKa = 11.84EE179 pKa = 4.1FEE181 pKa = 5.41DD182 pKa = 3.49GMEE185 pKa = 4.06VDD187 pKa = 5.01LAPAVAGQFEE197 pKa = 4.53DD198 pKa = 5.38AEE200 pKa = 4.32VDD202 pKa = 3.59HH203 pKa = 7.08
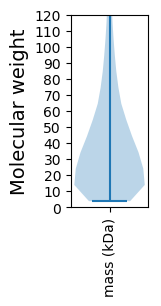
Molecular weight: 22.67 kDa
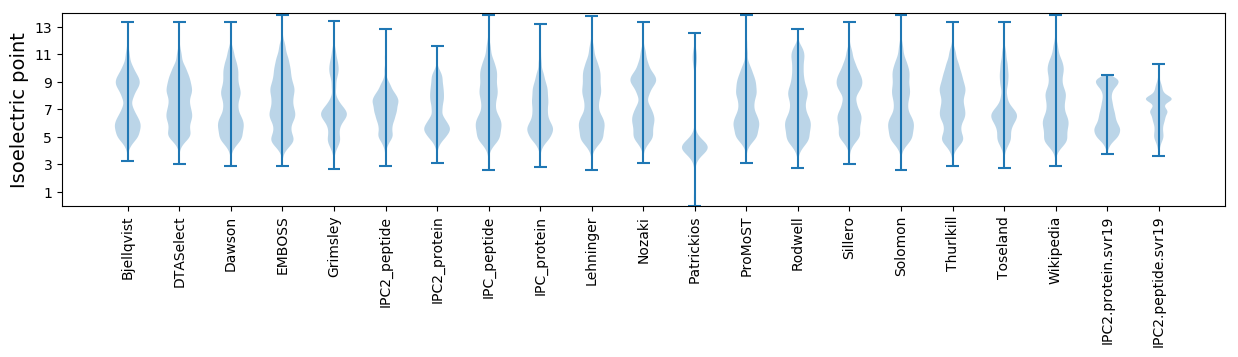
Isoelectric point according different methods:
Protein with the highest isoelectric point:
>tr|A0A099Z308|A0A099Z308_TINGU Eukaryotic translation initiation factor 3 subunit D (Fragment) OS=Tinamus guttatus OX=94827 GN=N309_04024 PE=3 SV=1
TT1 pKa = 6.86QATQRR6 pKa = 11.84TQATQRR12 pKa = 11.84TQATQRR18 pKa = 11.84TQATQRR24 pKa = 11.84TQATQRR30 pKa = 11.84TQATQRR36 pKa = 11.84TQATQRR42 pKa = 11.84TQATQLTQATQRR54 pKa = 11.84TQATQLTQATQRR66 pKa = 11.84TQATQRR72 pKa = 11.84TQATQRR78 pKa = 11.84TQATQRR84 pKa = 11.84TQATQRR90 pKa = 11.84TQATQRR96 pKa = 11.84TT97 pKa = 4.22
TT1 pKa = 6.86QATQRR6 pKa = 11.84TQATQRR12 pKa = 11.84TQATQRR18 pKa = 11.84TQATQRR24 pKa = 11.84TQATQRR30 pKa = 11.84TQATQRR36 pKa = 11.84TQATQRR42 pKa = 11.84TQATQLTQATQRR54 pKa = 11.84TQATQLTQATQRR66 pKa = 11.84TQATQRR72 pKa = 11.84TQATQRR78 pKa = 11.84TQATQRR84 pKa = 11.84TQATQRR90 pKa = 11.84TQATQRR96 pKa = 11.84TT97 pKa = 4.22
Molecular weight: 11.0 kDa
Isoelectric point according different methods:
Peptides (in silico digests for buttom-up proteomics)
Below you can find in silico digests of the whole proteome with Trypsin, Chymotrypsin, Trypsin+LysC, LysN, ArgC proteases suitable for different mass spec machines.| Try ESI |
 |
|---|
| ChTry ESI |
|
|---|
| ArgC ESI |
|
|---|
| LysN ESI |
|
|---|
| TryLysC ESI |
|
|---|
| Try MALDI |
|
|---|
| ChTry MALDI |
|
|---|
| ArgC MALDI |
|
|---|
| LysN MALDI |
|
|---|
| TryLysC MALDI |
|
|---|
| Try LTQ |
|
|---|
| ChTry LTQ |
|
|---|
| ArgC LTQ |
|
|---|
| LysN LTQ |
|
|---|
| TryLysC LTQ |
|
|---|
| Try MSlow |
|
|---|
| ChTry MSlow |
|
|---|
| ArgC MSlow |
|
|---|
| LysN MSlow |
|
|---|
| TryLysC MSlow |
|
|---|
| Try MShigh |
|
|---|
| ChTry MShigh |
|
|---|
| ArgC MShigh |
|
|---|
| LysN MShigh |
|
|---|
| TryLysC MShigh |
|
|---|
General Statistics
Number of major isoforms |
Number of additional isoforms |
Number of all proteins |
Number of amino acids |
Min. Seq. Length |
Max. Seq. Length |
Avg. Seq. Length |
Avg. Mol. Weight |
|---|---|---|---|---|---|---|---|
0 |
5354997 |
33 |
8744 |
400.3 |
45.02 |
Amino acid frequency
Ala |
Cys |
Asp |
Glu |
Phe |
Gly |
His |
Ile |
Lys |
Leu |
|---|---|---|---|---|---|---|---|---|---|
6.55 ± 0.019 | 2.258 ± 0.017 |
5.019 ± 0.014 | 7.209 ± 0.029 |
3.955 ± 0.015 | 5.844 ± 0.026 |
2.573 ± 0.01 | 4.98 ± 0.015 |
6.481 ± 0.027 | 9.816 ± 0.03 |
Met |
Asn |
Gln |
Pro |
Arg |
Ser |
Thr |
Val |
Trp |
Tyr |
|---|---|---|---|---|---|---|---|---|---|
2.228 ± 0.009 | 4.102 ± 0.014 |
5.204 ± 0.024 | 4.573 ± 0.018 |
5.349 ± 0.018 | 8.062 ± 0.03 |
5.274 ± 0.016 | 6.318 ± 0.018 |
1.2 ± 0.007 | 2.999 ± 0.013 |
Most of the basic statistics you can see at this page can be downloaded from this CSV file
See this proteome in:

Proteome-pI is available under Creative Commons Attribution-NoDerivs license, for more details see here
| Reference: Kozlowski LP. Proteome-pI 2.0: Proteome Isoelectric Point Database Update. Nucleic Acids Res. 2021, doi: 10.1093/nar/gkab944 | Contact: Lukasz P. Kozlowski |