Streptococcus satellite phage Javan733
Taxonomy: Viruses; unclassified bacterial viruses
Average proteome isoelectric point is 6.16
Get precalculated fractions of proteins
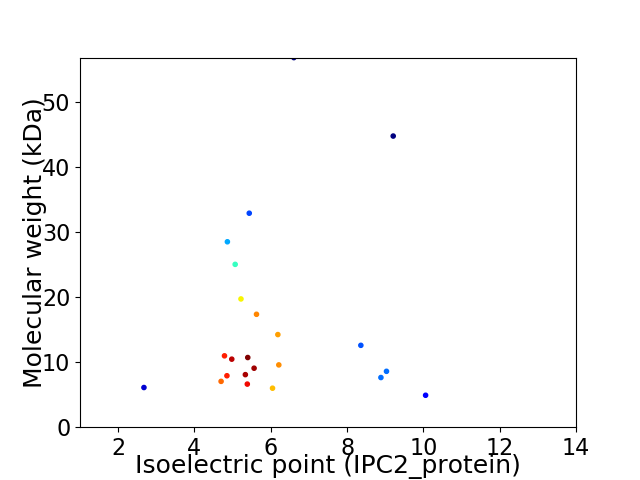
Virtual 2D-PAGE plot for 23 proteins (isoelectric point calculated using IPC2_protein)
Get csv file with sequences according to given criteria:
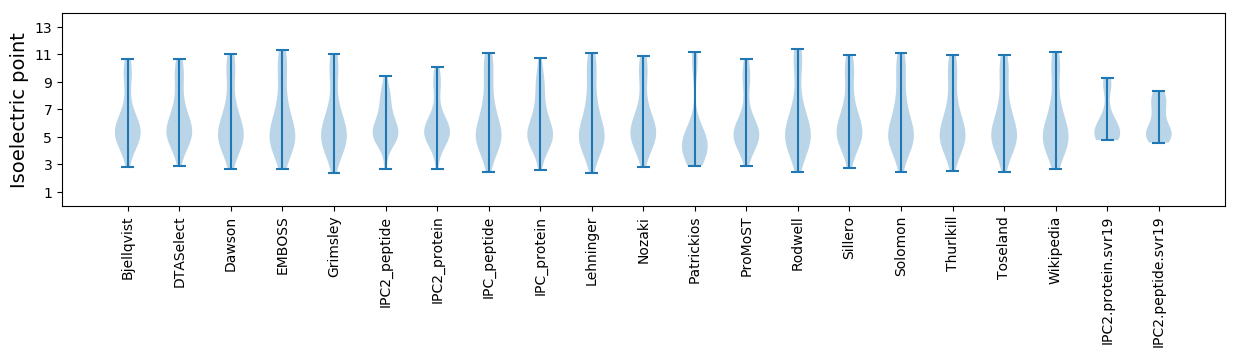
* You can choose from 21 different methods for calculating isoelectric point
Summary statistics related to proteome-wise predictions
Protein with the lowest isoelectric point:
>tr|A0A4D5ZV29|A0A4D5ZV29_9VIRU Uncharacterized protein OS=Streptococcus satellite phage Javan733 OX=2558827 GN=JavanS733_0016 PE=4 SV=1
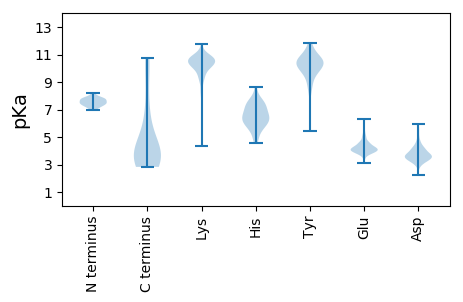
MM1 pKa = 7.25NFKK4 pKa = 10.19EE5 pKa = 4.41FKK7 pKa = 9.26TWLDD11 pKa = 3.49DD12 pKa = 3.81AVSVAEE18 pKa = 5.25AMALPEE24 pKa = 4.26NKK26 pKa = 9.89GVLDD30 pKa = 4.35DD31 pKa = 5.92LIEE34 pKa = 4.28NTANNLAFIAEE45 pKa = 4.28LVEE48 pKa = 3.7NRR50 pKa = 11.84QLIYY54 pKa = 10.4RR55 pKa = 11.84KK56 pKa = 9.18PRR58 pKa = 11.84HH59 pKa = 5.79EE60 pKa = 4.27DD61 pKa = 2.83
MM1 pKa = 7.25NFKK4 pKa = 10.19EE5 pKa = 4.41FKK7 pKa = 9.26TWLDD11 pKa = 3.49DD12 pKa = 3.81AVSVAEE18 pKa = 5.25AMALPEE24 pKa = 4.26NKK26 pKa = 9.89GVLDD30 pKa = 4.35DD31 pKa = 5.92LIEE34 pKa = 4.28NTANNLAFIAEE45 pKa = 4.28LVEE48 pKa = 3.7NRR50 pKa = 11.84QLIYY54 pKa = 10.4RR55 pKa = 11.84KK56 pKa = 9.18PRR58 pKa = 11.84HH59 pKa = 5.79EE60 pKa = 4.27DD61 pKa = 2.83
Molecular weight: 7.05 kDa
Isoelectric point according different methods:
Protein with the highest isoelectric point:
>tr|A0A4D5ZWX9|A0A4D5ZWX9_9VIRU Uncharacterized protein OS=Streptococcus satellite phage Javan733 OX=2558827 GN=JavanS733_0013 PE=4 SV=1
MM1 pKa = 7.25KK2 pKa = 10.36RR3 pKa = 11.84IATIFLLGLPKK14 pKa = 9.96VPKK17 pKa = 8.88MRR19 pKa = 11.84PIAYY23 pKa = 8.55PRR25 pKa = 11.84ATISNNPEE33 pKa = 3.14ARR35 pKa = 11.84GIYY38 pKa = 10.11LEE40 pKa = 4.06NKK42 pKa = 9.02KK43 pKa = 10.62
MM1 pKa = 7.25KK2 pKa = 10.36RR3 pKa = 11.84IATIFLLGLPKK14 pKa = 9.96VPKK17 pKa = 8.88MRR19 pKa = 11.84PIAYY23 pKa = 8.55PRR25 pKa = 11.84ATISNNPEE33 pKa = 3.14ARR35 pKa = 11.84GIYY38 pKa = 10.11LEE40 pKa = 4.06NKK42 pKa = 9.02KK43 pKa = 10.62
Molecular weight: 4.91 kDa
Isoelectric point according different methods:
Peptides (in silico digests for buttom-up proteomics)
Below you can find in silico digests of the whole proteome with Trypsin, Chymotrypsin, Trypsin+LysC, LysN, ArgC proteases suitable for different mass spec machines.| Try ESI |
 |
|---|
| ChTry ESI |
|
|---|
| ArgC ESI |
|
|---|
| LysN ESI |
|
|---|
| TryLysC ESI |
|
|---|
| Try MALDI |
|
|---|
| ChTry MALDI |
|
|---|
| ArgC MALDI |
|
|---|
| LysN MALDI |
|
|---|
| TryLysC MALDI |
|
|---|
| Try LTQ |
|
|---|
| ChTry LTQ |
|
|---|
| ArgC LTQ |
|
|---|
| LysN LTQ |
|
|---|
| TryLysC LTQ |
|
|---|
| Try MSlow |
|
|---|
| ChTry MSlow |
|
|---|
| ArgC MSlow |
|
|---|
| LysN MSlow |
|
|---|
| TryLysC MSlow |
|
|---|
| Try MShigh |
|
|---|
| ChTry MShigh |
|
|---|
| ArgC MShigh |
|
|---|
| LysN MShigh |
|
|---|
| TryLysC MShigh |
|
|---|
General Statistics
Number of major isoforms |
Number of additional isoforms |
Number of all proteins |
Number of amino acids |
Min. Seq. Length |
Max. Seq. Length |
Avg. Seq. Length |
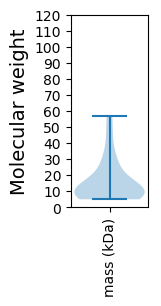
Avg. Mol. Weight |
|---|---|---|---|---|---|---|---|
0 |
3160 |
43 |
484 |
137.4 |
15.9 |
Amino acid frequency
Ala |
Cys |
Asp |
Glu |
Phe |
Gly |
His |
Ile |
Lys |
Leu |
|---|---|---|---|---|---|---|---|---|---|
6.044 ± 0.296 | 0.538 ± 0.108 |
6.424 ± 0.56 | 9.304 ± 0.828 |
4.399 ± 0.366 | 4.652 ± 0.253 |
1.266 ± 0.248 | 7.12 ± 0.395 |
9.399 ± 0.594 | 10.19 ± 0.51 |
Met |
Asn |
Gln |
Pro |
Arg |
Ser |
Thr |
Val |
Trp |
Tyr |
|---|---|---|---|---|---|---|---|---|---|
2.69 ± 0.286 | 5.253 ± 0.488 |
2.69 ± 0.316 | 3.892 ± 0.363 |
5.38 ± 0.372 | 4.81 ± 0.412 |
6.013 ± 0.406 | 5.158 ± 0.442 |
0.601 ± 0.128 | 4.177 ± 0.262 |
Most of the basic statistics you can see at this page can be downloaded from this CSV file
See this proteome in:

Proteome-pI is available under Creative Commons Attribution-NoDerivs license, for more details see here
| Reference: Kozlowski LP. Proteome-pI 2.0: Proteome Isoelectric Point Database Update. Nucleic Acids Res. 2021, doi: 10.1093/nar/gkab944 | Contact: Lukasz P. Kozlowski |