White sturgeon adenovirus 1
Taxonomy: Viruses; Varidnaviria; Bamfordvirae; Preplasmiviricota; Tectiliviricetes; Rowavirales; Adenoviridae; Ichtadenovirus; Sturgeon ichtadenovirus A
Average proteome isoelectric point is 6.36
Get precalculated fractions of proteins
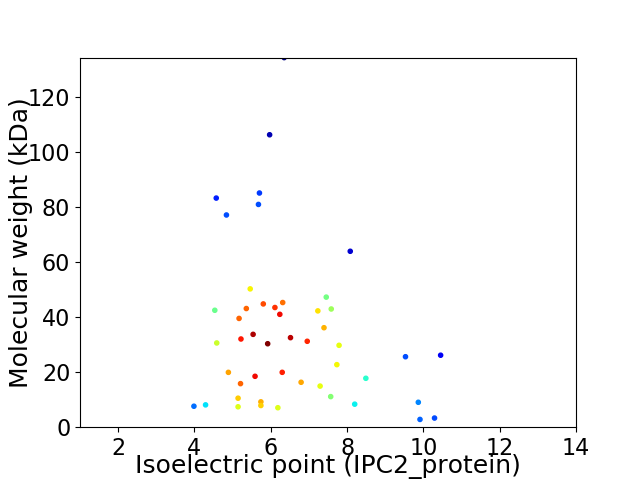
Virtual 2D-PAGE plot for 48 proteins (isoelectric point calculated using IPC2_protein)
Get csv file with sequences according to given criteria:
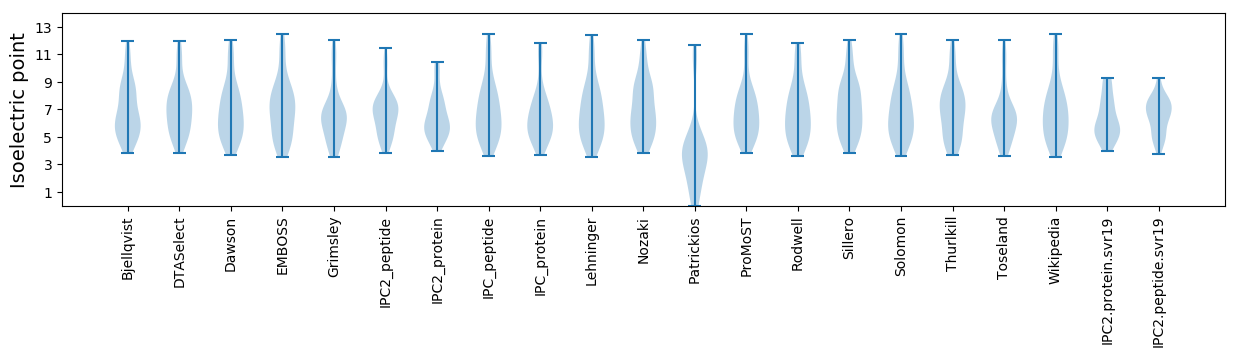
* You can choose from 21 different methods for calculating isoelectric point
Summary statistics related to proteome-wise predictions
Protein with the lowest isoelectric point:
>tr|A0A4P8PIX1|A0A4P8PIX1_9ADEN PVI OS=White sturgeon adenovirus 1 OX=2580388 PE=4 SV=1
MM1 pKa = 7.76LLEE4 pKa = 3.89FLEE7 pKa = 4.75AFVEE11 pKa = 4.97AIGSFLAYY19 pKa = 9.64ICFCEE24 pKa = 4.25EE25 pKa = 3.71ASLLCIEE32 pKa = 4.46VSEE35 pKa = 4.25EE36 pKa = 3.69QFEE39 pKa = 4.55NFVKK43 pKa = 10.66FCVEE47 pKa = 3.78QTLLTLFITLFYY59 pKa = 10.52ILRR62 pKa = 11.84DD63 pKa = 3.31GWW65 pKa = 3.6
MM1 pKa = 7.76LLEE4 pKa = 3.89FLEE7 pKa = 4.75AFVEE11 pKa = 4.97AIGSFLAYY19 pKa = 9.64ICFCEE24 pKa = 4.25EE25 pKa = 3.71ASLLCIEE32 pKa = 4.46VSEE35 pKa = 4.25EE36 pKa = 3.69QFEE39 pKa = 4.55NFVKK43 pKa = 10.66FCVEE47 pKa = 3.78QTLLTLFITLFYY59 pKa = 10.52ILRR62 pKa = 11.84DD63 pKa = 3.31GWW65 pKa = 3.6
Molecular weight: 7.63 kDa
Isoelectric point according different methods:
Protein with the highest isoelectric point:
>tr|A0A4P8PQV5|A0A4P8PQV5_9ADEN ORF1 OS=White sturgeon adenovirus 1 OX=2580388 PE=4 SV=1
MM1 pKa = 7.44YY2 pKa = 9.16STGDD6 pKa = 3.25STGWGRR12 pKa = 11.84RR13 pKa = 11.84VSQIRR18 pKa = 11.84FSFQIFF24 pKa = 3.19
MM1 pKa = 7.44YY2 pKa = 9.16STGDD6 pKa = 3.25STGWGRR12 pKa = 11.84RR13 pKa = 11.84VSQIRR18 pKa = 11.84FSFQIFF24 pKa = 3.19
Molecular weight: 2.83 kDa
Isoelectric point according different methods:
Peptides (in silico digests for buttom-up proteomics)
Below you can find in silico digests of the whole proteome with Trypsin, Chymotrypsin, Trypsin+LysC, LysN, ArgC proteases suitable for different mass spec machines.| Try ESI |
 |
|---|
| ChTry ESI |
|
|---|
| ArgC ESI |
|
|---|
| LysN ESI |
|
|---|
| TryLysC ESI |
|
|---|
| Try MALDI |
|
|---|
| ChTry MALDI |
|
|---|
| ArgC MALDI |
|
|---|
| LysN MALDI |
|
|---|
| TryLysC MALDI |
|
|---|
| Try LTQ |
|
|---|
| ChTry LTQ |
|
|---|
| ArgC LTQ |
|
|---|
| LysN LTQ |
|
|---|
| TryLysC LTQ |
|
|---|
| Try MSlow |
|
|---|
| ChTry MSlow |
|
|---|
| ArgC MSlow |
|
|---|
| LysN MSlow |
|
|---|
| TryLysC MSlow |
|
|---|
| Try MShigh |
|
|---|
| ChTry MShigh |
|
|---|
| ArgC MShigh |
|
|---|
| LysN MShigh |
|
|---|
| TryLysC MShigh |
|
|---|
General Statistics
Number of major isoforms |
Number of additional isoforms |
Number of all proteins |
Number of amino acids |
Min. Seq. Length |
Max. Seq. Length |
Avg. Seq. Length |
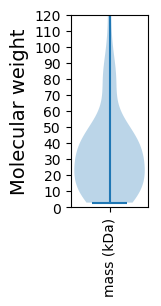
Avg. Mol. Weight |
|---|---|---|---|---|---|---|---|
0 |
14671 |
24 |
1166 |
305.6 |
34.62 |
Amino acid frequency
Ala |
Cys |
Asp |
Glu |
Phe |
Gly |
His |
Ile |
Lys |
Leu |
|---|---|---|---|---|---|---|---|---|---|
5.855 ± 0.228 | 2.488 ± 0.269 |
5.323 ± 0.178 | 5.392 ± 0.343 |
4.792 ± 0.209 | 5.617 ± 0.336 |
2.331 ± 0.192 | 5.61 ± 0.257 |
5.398 ± 0.354 | 8.636 ± 0.273 |
Met |
Asn |
Gln |
Pro |
Arg |
Ser |
Thr |
Val |
Trp |
Tyr |
|---|---|---|---|---|---|---|---|---|---|
2.74 ± 0.138 | 6.032 ± 0.3 |
5.712 ± 0.315 | 4.015 ± 0.174 |
4.69 ± 0.339 | 7.232 ± 0.228 |
6.4 ± 0.277 | 5.916 ± 0.205 |
1.254 ± 0.117 | 4.567 ± 0.262 |
Most of the basic statistics you can see at this page can be downloaded from this CSV file
See this proteome in:

Proteome-pI is available under Creative Commons Attribution-NoDerivs license, for more details see here
| Reference: Kozlowski LP. Proteome-pI 2.0: Proteome Isoelectric Point Database Update. Nucleic Acids Res. 2021, doi: 10.1093/nar/gkab944 | Contact: Lukasz P. Kozlowski |