Sulfitobacter sp. S4J41
Taxonomy: cellular organisms; Bacteria; Proteobacteria; Alphaproteobacteria; Rhodobacterales; Rhodobacteraceae; Antarcticimicrobium
Average proteome isoelectric point is 6.26
Get precalculated fractions of proteins
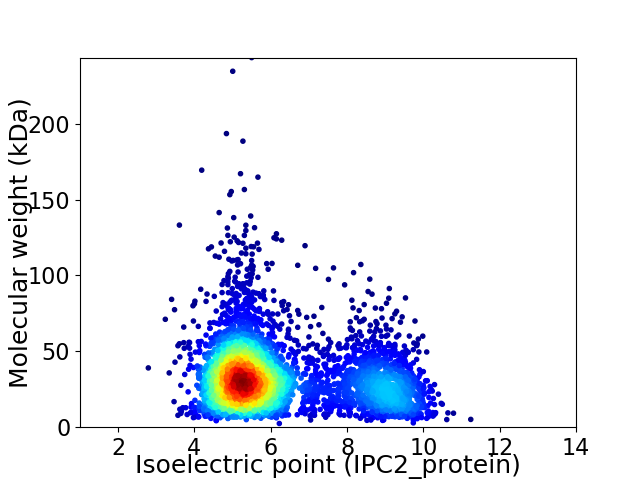
Virtual 2D-PAGE plot for 4217 proteins (isoelectric point calculated using IPC2_protein)
Get csv file with sequences according to given criteria:
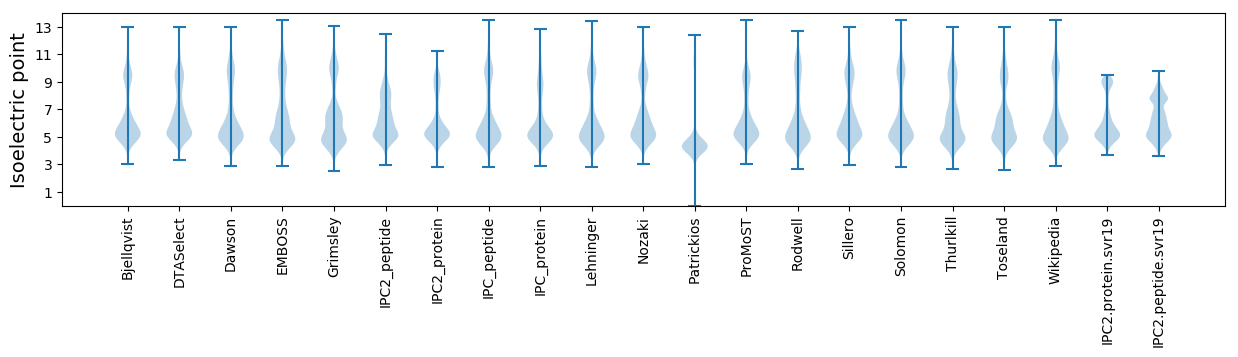
* You can choose from 21 different methods for calculating isoelectric point
Summary statistics related to proteome-wise predictions
Protein with the lowest isoelectric point:
>tr|A0A4R5F0K9|A0A4R5F0K9_9RHOB Glycosyltransferase family 2 protein OS=Sulfitobacter sp. S4J41 OX=2546227 GN=E1B25_00805 PE=4 SV=1
MM1 pKa = 7.59SKK3 pKa = 8.77TLTAALALGAPVLFSASDD21 pKa = 3.47VLAQEE26 pKa = 4.51SRR28 pKa = 11.84RR29 pKa = 11.84FTWDD33 pKa = 2.92GEE35 pKa = 4.1IEE37 pKa = 3.88IDD39 pKa = 3.66YY40 pKa = 11.13EE41 pKa = 4.98SIFDD45 pKa = 3.72SDD47 pKa = 3.87VPANEE52 pKa = 4.17SDD54 pKa = 3.25TAYY57 pKa = 10.75GSGEE61 pKa = 3.97FNAAYY66 pKa = 10.57ALTDD70 pKa = 3.43RR71 pKa = 11.84VAIFGGLTFEE81 pKa = 4.38EE82 pKa = 4.93LEE84 pKa = 4.22NAAGNTGYY92 pKa = 11.1GFYY95 pKa = 10.47FHH97 pKa = 7.4EE98 pKa = 5.73LGLQFEE104 pKa = 4.66TGAASFQIGKK114 pKa = 7.75VHH116 pKa = 7.06PEE118 pKa = 4.26FGTAWDD124 pKa = 4.06TAAGFYY130 pKa = 10.82GSALAEE136 pKa = 4.52DD137 pKa = 4.84YY138 pKa = 10.56EE139 pKa = 4.7LSEE142 pKa = 4.31QIGVLAEE149 pKa = 4.49LDD151 pKa = 3.63LGTAGTLAMGVFYY164 pKa = 10.94ADD166 pKa = 3.66DD167 pKa = 3.91TGLSDD172 pKa = 4.0SLGFNRR178 pKa = 11.84GRR180 pKa = 11.84NTTAAGGAGNTGTLNNASLQWSKK203 pKa = 11.61DD204 pKa = 2.96WGQTFAYY211 pKa = 9.86VGARR215 pKa = 11.84FLTAGTGDD223 pKa = 3.38VSDD226 pKa = 3.7EE227 pKa = 4.15TGIVAGVGHH236 pKa = 6.38SLGNGLDD243 pKa = 3.7LFGEE247 pKa = 4.6VAAFDD252 pKa = 4.83GYY254 pKa = 11.27GGSADD259 pKa = 3.75DD260 pKa = 3.83ATYY263 pKa = 8.77ATLNAAYY270 pKa = 9.95AIGEE274 pKa = 4.28LTLSGTYY281 pKa = 11.04AMRR284 pKa = 11.84DD285 pKa = 3.04VDD287 pKa = 4.07SAGRR291 pKa = 11.84TDD293 pKa = 4.42LVSLAAEE300 pKa = 4.21YY301 pKa = 10.85EE302 pKa = 4.36LTNGMTLGGALARR315 pKa = 11.84VDD317 pKa = 3.82DD318 pKa = 5.08AGVADD323 pKa = 4.09TLFGVNLVIPFGGG336 pKa = 3.3
MM1 pKa = 7.59SKK3 pKa = 8.77TLTAALALGAPVLFSASDD21 pKa = 3.47VLAQEE26 pKa = 4.51SRR28 pKa = 11.84RR29 pKa = 11.84FTWDD33 pKa = 2.92GEE35 pKa = 4.1IEE37 pKa = 3.88IDD39 pKa = 3.66YY40 pKa = 11.13EE41 pKa = 4.98SIFDD45 pKa = 3.72SDD47 pKa = 3.87VPANEE52 pKa = 4.17SDD54 pKa = 3.25TAYY57 pKa = 10.75GSGEE61 pKa = 3.97FNAAYY66 pKa = 10.57ALTDD70 pKa = 3.43RR71 pKa = 11.84VAIFGGLTFEE81 pKa = 4.38EE82 pKa = 4.93LEE84 pKa = 4.22NAAGNTGYY92 pKa = 11.1GFYY95 pKa = 10.47FHH97 pKa = 7.4EE98 pKa = 5.73LGLQFEE104 pKa = 4.66TGAASFQIGKK114 pKa = 7.75VHH116 pKa = 7.06PEE118 pKa = 4.26FGTAWDD124 pKa = 4.06TAAGFYY130 pKa = 10.82GSALAEE136 pKa = 4.52DD137 pKa = 4.84YY138 pKa = 10.56EE139 pKa = 4.7LSEE142 pKa = 4.31QIGVLAEE149 pKa = 4.49LDD151 pKa = 3.63LGTAGTLAMGVFYY164 pKa = 10.94ADD166 pKa = 3.66DD167 pKa = 3.91TGLSDD172 pKa = 4.0SLGFNRR178 pKa = 11.84GRR180 pKa = 11.84NTTAAGGAGNTGTLNNASLQWSKK203 pKa = 11.61DD204 pKa = 2.96WGQTFAYY211 pKa = 9.86VGARR215 pKa = 11.84FLTAGTGDD223 pKa = 3.38VSDD226 pKa = 3.7EE227 pKa = 4.15TGIVAGVGHH236 pKa = 6.38SLGNGLDD243 pKa = 3.7LFGEE247 pKa = 4.6VAAFDD252 pKa = 4.83GYY254 pKa = 11.27GGSADD259 pKa = 3.75DD260 pKa = 3.83ATYY263 pKa = 8.77ATLNAAYY270 pKa = 9.95AIGEE274 pKa = 4.28LTLSGTYY281 pKa = 11.04AMRR284 pKa = 11.84DD285 pKa = 3.04VDD287 pKa = 4.07SAGRR291 pKa = 11.84TDD293 pKa = 4.42LVSLAAEE300 pKa = 4.21YY301 pKa = 10.85EE302 pKa = 4.36LTNGMTLGGALARR315 pKa = 11.84VDD317 pKa = 3.82DD318 pKa = 5.08AGVADD323 pKa = 4.09TLFGVNLVIPFGGG336 pKa = 3.3
Molecular weight: 34.75 kDa
Isoelectric point according different methods:
Protein with the highest isoelectric point:
>tr|A0A4V2Z8A9|A0A4V2Z8A9_9RHOB TIGR02302 family protein OS=Sulfitobacter sp. S4J41 OX=2546227 GN=E1B25_06230 PE=4 SV=1
MM1 pKa = 7.45KK2 pKa = 9.61RR3 pKa = 11.84TFQPSNLVRR12 pKa = 11.84KK13 pKa = 9.18RR14 pKa = 11.84RR15 pKa = 11.84HH16 pKa = 4.42GFRR19 pKa = 11.84ARR21 pKa = 11.84MATKK25 pKa = 10.37AGRR28 pKa = 11.84KK29 pKa = 8.54ILNARR34 pKa = 11.84RR35 pKa = 11.84ARR37 pKa = 11.84GRR39 pKa = 11.84KK40 pKa = 9.07SLSAA44 pKa = 3.93
MM1 pKa = 7.45KK2 pKa = 9.61RR3 pKa = 11.84TFQPSNLVRR12 pKa = 11.84KK13 pKa = 9.18RR14 pKa = 11.84RR15 pKa = 11.84HH16 pKa = 4.42GFRR19 pKa = 11.84ARR21 pKa = 11.84MATKK25 pKa = 10.37AGRR28 pKa = 11.84KK29 pKa = 8.54ILNARR34 pKa = 11.84RR35 pKa = 11.84ARR37 pKa = 11.84GRR39 pKa = 11.84KK40 pKa = 9.07SLSAA44 pKa = 3.93
Molecular weight: 5.14 kDa
Isoelectric point according different methods:
Peptides (in silico digests for buttom-up proteomics)
Below you can find in silico digests of the whole proteome with Trypsin, Chymotrypsin, Trypsin+LysC, LysN, ArgC proteases suitable for different mass spec machines.| Try ESI |
 |
|---|
| ChTry ESI |
|
|---|
| ArgC ESI |
|
|---|
| LysN ESI |
|
|---|
| TryLysC ESI |
|
|---|
| Try MALDI |
|
|---|
| ChTry MALDI |
|
|---|
| ArgC MALDI |
|
|---|
| LysN MALDI |
|
|---|
| TryLysC MALDI |
|
|---|
| Try LTQ |
|
|---|
| ChTry LTQ |
|
|---|
| ArgC LTQ |
|
|---|
| LysN LTQ |
|
|---|
| TryLysC LTQ |
|
|---|
| Try MSlow |
|
|---|
| ChTry MSlow |
|
|---|
| ArgC MSlow |
|
|---|
| LysN MSlow |
|
|---|
| TryLysC MSlow |
|
|---|
| Try MShigh |
|
|---|
| ChTry MShigh |
|
|---|
| ArgC MShigh |
|
|---|
| LysN MShigh |
|
|---|
| TryLysC MShigh |
|
|---|
General Statistics
Number of major isoforms |
Number of additional isoforms |
Number of all proteins |
Number of amino acids |
Min. Seq. Length |
Max. Seq. Length |
Avg. Seq. Length |
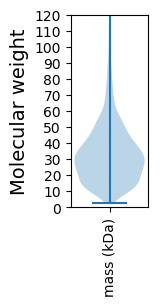
Avg. Mol. Weight |
|---|---|---|---|---|---|---|---|
0 |
1348334 |
22 |
2210 |
319.7 |
34.66 |
Amino acid frequency
Ala |
Cys |
Asp |
Glu |
Phe |
Gly |
His |
Ile |
Lys |
Leu |
|---|---|---|---|---|---|---|---|---|---|
12.384 ± 0.049 | 0.898 ± 0.011 |
5.972 ± 0.035 | 5.711 ± 0.031 |
3.647 ± 0.021 | 8.783 ± 0.035 |
2.047 ± 0.016 | 5.107 ± 0.024 |
3.129 ± 0.03 | 10.311 ± 0.048 |
Met |
Asn |
Gln |
Pro |
Arg |
Ser |
Thr |
Val |
Trp |
Tyr |
|---|---|---|---|---|---|---|---|---|---|
2.825 ± 0.018 | 2.464 ± 0.017 |
5.19 ± 0.028 | 3.259 ± 0.021 |
6.816 ± 0.037 | 5.16 ± 0.027 |
5.476 ± 0.025 | 7.241 ± 0.029 |
1.36 ± 0.016 | 2.219 ± 0.019 |
Most of the basic statistics you can see at this page can be downloaded from this CSV file
See this proteome in:

Proteome-pI is available under Creative Commons Attribution-NoDerivs license, for more details see here
| Reference: Kozlowski LP. Proteome-pI 2.0: Proteome Isoelectric Point Database Update. Nucleic Acids Res. 2021, doi: 10.1093/nar/gkab944 | Contact: Lukasz P. Kozlowski |