Bosea sp. OK403
Taxonomy: cellular organisms; Bacteria; Proteobacteria; Alphaproteobacteria; Hyphomicrobiales; Boseaceae; Bosea; unclassified Bosea
Average proteome isoelectric point is 6.85
Get precalculated fractions of proteins

Virtual 2D-PAGE plot for 6030 proteins (isoelectric point calculated using IPC2_protein)
Get csv file with sequences according to given criteria:
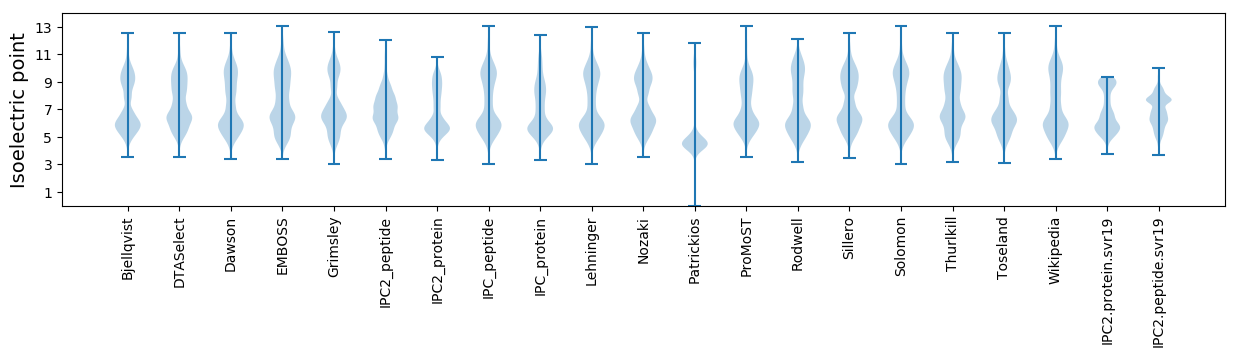
* You can choose from 21 different methods for calculating isoelectric point
Summary statistics related to proteome-wise predictions
Protein with the lowest isoelectric point:
>tr|A0A1I3L178|A0A1I3L178_9BRAD Uncharacterized protein OS=Bosea sp. OK403 OX=1855286 GN=SAMN05216304_103499 PE=4 SV=1
MM1 pKa = 7.58SFTLTPDD8 pKa = 3.43NAPLADD14 pKa = 3.73VAGLNAPIGSTILKK28 pKa = 10.17HH29 pKa = 6.3LDD31 pKa = 2.56QWYY34 pKa = 10.33YY35 pKa = 11.46LDD37 pKa = 5.24DD38 pKa = 5.07SIGAIAA44 pKa = 4.94
MM1 pKa = 7.58SFTLTPDD8 pKa = 3.43NAPLADD14 pKa = 3.73VAGLNAPIGSTILKK28 pKa = 10.17HH29 pKa = 6.3LDD31 pKa = 2.56QWYY34 pKa = 10.33YY35 pKa = 11.46LDD37 pKa = 5.24DD38 pKa = 5.07SIGAIAA44 pKa = 4.94
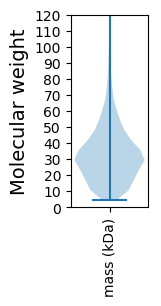
Molecular weight: 4.69 kDa
Isoelectric point according different methods:
Protein with the highest isoelectric point:
>tr|A0A1I3R4M1|A0A1I3R4M1_9BRAD Chitooligosaccharide deacetylase OS=Bosea sp. OK403 OX=1855286 GN=SAMN05216304_107212 PE=3 SV=1
MM1 pKa = 7.07GVIVAVVIMAASGMVVRR18 pKa = 11.84VLFDD22 pKa = 3.56RR23 pKa = 11.84FASRR27 pKa = 11.84RR28 pKa = 11.84SMVMAAATLIRR39 pKa = 11.84GSLHH43 pKa = 5.84GRR45 pKa = 11.84IAMSGVVMSVVIMPASRR62 pKa = 11.84VVVRR66 pKa = 11.84MLFGGLWSRR75 pKa = 11.84RR76 pKa = 11.84GMVMAAATLIHH87 pKa = 6.53RR88 pKa = 11.84CLRR91 pKa = 11.84GRR93 pKa = 11.84VAKK96 pKa = 10.53NVVIMSLVVMSAVVMVTRR114 pKa = 5.02
MM1 pKa = 7.07GVIVAVVIMAASGMVVRR18 pKa = 11.84VLFDD22 pKa = 3.56RR23 pKa = 11.84FASRR27 pKa = 11.84RR28 pKa = 11.84SMVMAAATLIRR39 pKa = 11.84GSLHH43 pKa = 5.84GRR45 pKa = 11.84IAMSGVVMSVVIMPASRR62 pKa = 11.84VVVRR66 pKa = 11.84MLFGGLWSRR75 pKa = 11.84RR76 pKa = 11.84GMVMAAATLIHH87 pKa = 6.53RR88 pKa = 11.84CLRR91 pKa = 11.84GRR93 pKa = 11.84VAKK96 pKa = 10.53NVVIMSLVVMSAVVMVTRR114 pKa = 5.02
Molecular weight: 12.26 kDa
Isoelectric point according different methods:
Peptides (in silico digests for buttom-up proteomics)
Below you can find in silico digests of the whole proteome with Trypsin, Chymotrypsin, Trypsin+LysC, LysN, ArgC proteases suitable for different mass spec machines.| Try ESI |
 |
|---|
| ChTry ESI |
|
|---|
| ArgC ESI |
|
|---|
| LysN ESI |
|
|---|
| TryLysC ESI |
|
|---|
| Try MALDI |
|
|---|
| ChTry MALDI |
|
|---|
| ArgC MALDI |
|
|---|
| LysN MALDI |
|
|---|
| TryLysC MALDI |
|
|---|
| Try LTQ |
|
|---|
| ChTry LTQ |
|
|---|
| ArgC LTQ |
|
|---|
| LysN LTQ |
|
|---|
| TryLysC LTQ |
|
|---|
| Try MSlow |
|
|---|
| ChTry MSlow |
|
|---|
| ArgC MSlow |
|
|---|
| LysN MSlow |
|
|---|
| TryLysC MSlow |
|
|---|
| Try MShigh |
|
|---|
| ChTry MShigh |
|
|---|
| ArgC MShigh |
|
|---|
| LysN MShigh |
|
|---|
| TryLysC MShigh |
|
|---|
General Statistics
Number of major isoforms |
Number of additional isoforms |
Number of all proteins |
Number of amino acids |
Min. Seq. Length |
Max. Seq. Length |
Avg. Seq. Length |
Avg. Mol. Weight |
|---|---|---|---|---|---|---|---|
0 |
1935374 |
39 |
6419 |
321.0 |
34.58 |
Amino acid frequency
Ala |
Cys |
Asp |
Glu |
Phe |
Gly |
His |
Ile |
Lys |
Leu |
|---|---|---|---|---|---|---|---|---|---|
13.431 ± 0.046 | 0.811 ± 0.009 |
5.215 ± 0.023 | 5.366 ± 0.029 |
3.712 ± 0.022 | 8.764 ± 0.039 |
1.902 ± 0.017 | 5.281 ± 0.023 |
3.155 ± 0.024 | 10.651 ± 0.043 |
Met |
Asn |
Gln |
Pro |
Arg |
Ser |
Thr |
Val |
Trp |
Tyr |
|---|---|---|---|---|---|---|---|---|---|
2.382 ± 0.015 | 2.36 ± 0.021 |
5.342 ± 0.026 | 3.099 ± 0.016 |
7.097 ± 0.032 | 5.461 ± 0.029 |
5.248 ± 0.034 | 7.348 ± 0.026 |
1.297 ± 0.014 | 2.079 ± 0.016 |
Most of the basic statistics you can see at this page can be downloaded from this CSV file
See this proteome in:

Proteome-pI is available under Creative Commons Attribution-NoDerivs license, for more details see here
| Reference: Kozlowski LP. Proteome-pI 2.0: Proteome Isoelectric Point Database Update. Nucleic Acids Res. 2021, doi: 10.1093/nar/gkab944 | Contact: Lukasz P. Kozlowski |