Rivibacter subsaxonicus
Taxonomy: cellular organisms; Bacteria; Proteobacteria; Betaproteobacteria; Burkholderiales; Burkholderiales genera incertae sedis; Rivibacter
Average proteome isoelectric point is 6.98
Get precalculated fractions of proteins
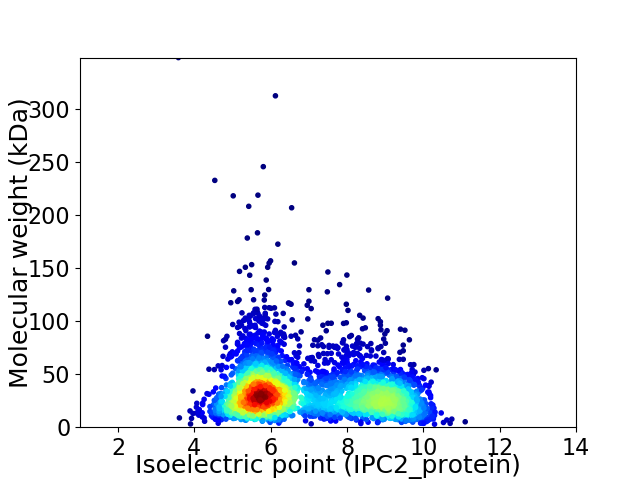
Virtual 2D-PAGE plot for 3641 proteins (isoelectric point calculated using IPC2_protein)
Get csv file with sequences according to given criteria:
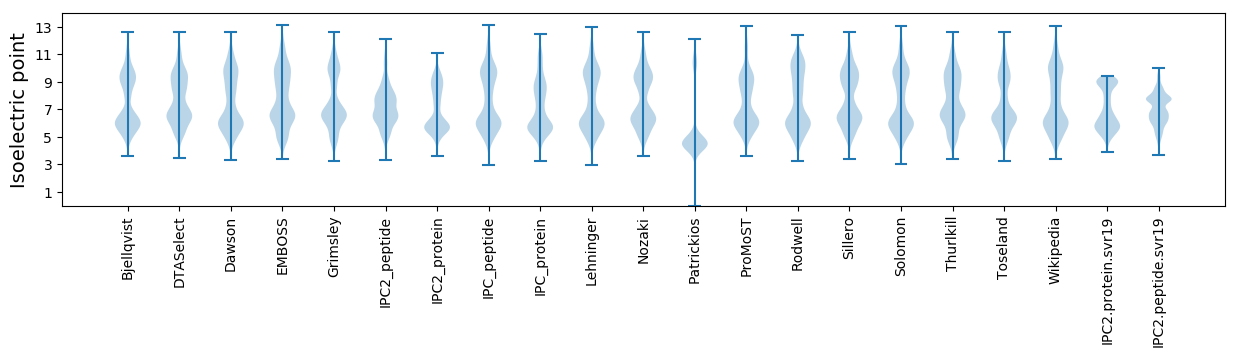
* You can choose from 21 different methods for calculating isoelectric point
Summary statistics related to proteome-wise predictions

Protein with the lowest isoelectric point:
>tr|A0A4Q7VVR3|A0A4Q7VVR3_9BURK Uncharacterized protein OS=Rivibacter subsaxonicus OX=457575 GN=EV670_1479 PE=4 SV=1
MM1 pKa = 7.37QSTSLTRR8 pKa = 11.84AAALIALACLALAGCSGGGDD28 pKa = 3.64YY29 pKa = 8.91EE30 pKa = 4.39QPPPAPVAEE39 pKa = 4.2ATEE42 pKa = 4.36VPISAVASSRR52 pKa = 11.84AFTDD56 pKa = 3.29YY57 pKa = 11.21AAALAPSDD65 pKa = 3.76SAEE68 pKa = 3.93ALGLGALGDD77 pKa = 4.12ASPVDD82 pKa = 4.27DD83 pKa = 4.8SGEE86 pKa = 3.96PLPIGG91 pKa = 3.87
MM1 pKa = 7.37QSTSLTRR8 pKa = 11.84AAALIALACLALAGCSGGGDD28 pKa = 3.64YY29 pKa = 8.91EE30 pKa = 4.39QPPPAPVAEE39 pKa = 4.2ATEE42 pKa = 4.36VPISAVASSRR52 pKa = 11.84AFTDD56 pKa = 3.29YY57 pKa = 11.21AAALAPSDD65 pKa = 3.76SAEE68 pKa = 3.93ALGLGALGDD77 pKa = 4.12ASPVDD82 pKa = 4.27DD83 pKa = 4.8SGEE86 pKa = 3.96PLPIGG91 pKa = 3.87
Molecular weight: 8.76 kDa
Isoelectric point according different methods:
Protein with the highest isoelectric point:
>tr|A0A4Q7VW70|A0A4Q7VW70_9BURK Uncharacterized protein OS=Rivibacter subsaxonicus OX=457575 GN=EV670_1670 PE=4 SV=1
MM1 pKa = 7.35KK2 pKa = 9.43RR3 pKa = 11.84TYY5 pKa = 10.07QPSKK9 pKa = 9.07IRR11 pKa = 11.84RR12 pKa = 11.84ARR14 pKa = 11.84THH16 pKa = 5.91GFLVRR21 pKa = 11.84MKK23 pKa = 9.94TRR25 pKa = 11.84GGKK28 pKa = 9.73AVISARR34 pKa = 11.84RR35 pKa = 11.84AKK37 pKa = 9.85GRR39 pKa = 11.84KK40 pKa = 9.07RR41 pKa = 11.84LGLL44 pKa = 3.7
MM1 pKa = 7.35KK2 pKa = 9.43RR3 pKa = 11.84TYY5 pKa = 10.07QPSKK9 pKa = 9.07IRR11 pKa = 11.84RR12 pKa = 11.84ARR14 pKa = 11.84THH16 pKa = 5.91GFLVRR21 pKa = 11.84MKK23 pKa = 9.94TRR25 pKa = 11.84GGKK28 pKa = 9.73AVISARR34 pKa = 11.84RR35 pKa = 11.84AKK37 pKa = 9.85GRR39 pKa = 11.84KK40 pKa = 9.07RR41 pKa = 11.84LGLL44 pKa = 3.7
Molecular weight: 5.1 kDa
Isoelectric point according different methods:
Peptides (in silico digests for buttom-up proteomics)
Below you can find in silico digests of the whole proteome with Trypsin, Chymotrypsin, Trypsin+LysC, LysN, ArgC proteases suitable for different mass spec machines.| Try ESI |
 |
|---|
| ChTry ESI |
|
|---|
| ArgC ESI |
|
|---|
| LysN ESI |
|
|---|
| TryLysC ESI |
|
|---|
| Try MALDI |
|
|---|
| ChTry MALDI |
|
|---|
| ArgC MALDI |
|
|---|
| LysN MALDI |
|
|---|
| TryLysC MALDI |
|
|---|
| Try LTQ |
|
|---|
| ChTry LTQ |
|
|---|
| ArgC LTQ |
|
|---|
| LysN LTQ |
|
|---|
| TryLysC LTQ |
|
|---|
| Try MSlow |
|
|---|
| ChTry MSlow |
|
|---|
| ArgC MSlow |
|
|---|
| LysN MSlow |
|
|---|
| TryLysC MSlow |
|
|---|
| Try MShigh |
|
|---|
| ChTry MShigh |
|
|---|
| ArgC MShigh |
|
|---|
| LysN MShigh |
|
|---|
| TryLysC MShigh |
|
|---|
General Statistics
Number of major isoforms |
Number of additional isoforms |
Number of all proteins |
Number of amino acids |
Min. Seq. Length |
Max. Seq. Length |
Avg. Seq. Length |
Avg. Mol. Weight |
|---|---|---|---|---|---|---|---|
0 |
1204091 |
29 |
3433 |
330.7 |
35.7 |
Amino acid frequency
Ala |
Cys |
Asp |
Glu |
Phe |
Gly |
His |
Ile |
Lys |
Leu |
|---|---|---|---|---|---|---|---|---|---|
13.993 ± 0.066 | 0.876 ± 0.013 |
5.124 ± 0.036 | 5.422 ± 0.038 |
3.454 ± 0.025 | 8.632 ± 0.039 |
2.143 ± 0.02 | 4.035 ± 0.03 |
2.845 ± 0.04 | 11.232 ± 0.056 |
Met |
Asn |
Gln |
Pro |
Arg |
Ser |
Thr |
Val |
Trp |
Tyr |
|---|---|---|---|---|---|---|---|---|---|
2.181 ± 0.02 | 2.301 ± 0.028 |
5.499 ± 0.034 | 3.621 ± 0.021 |
7.515 ± 0.045 | 5.21 ± 0.03 |
4.757 ± 0.032 | 7.55 ± 0.033 |
1.552 ± 0.02 | 2.059 ± 0.02 |
Most of the basic statistics you can see at this page can be downloaded from this CSV file
See this proteome in:

Proteome-pI is available under Creative Commons Attribution-NoDerivs license, for more details see here
| Reference: Kozlowski LP. Proteome-pI 2.0: Proteome Isoelectric Point Database Update. Nucleic Acids Res. 2021, doi: 10.1093/nar/gkab944 | Contact: Lukasz P. Kozlowski |