Hyperthermophilic Archaeal Virus 1
Taxonomy: Viruses; unclassified viruses; unclassified DNA viruses; unclassified dsDNA viruses
Average proteome isoelectric point is 7.03
Get precalculated fractions of proteins
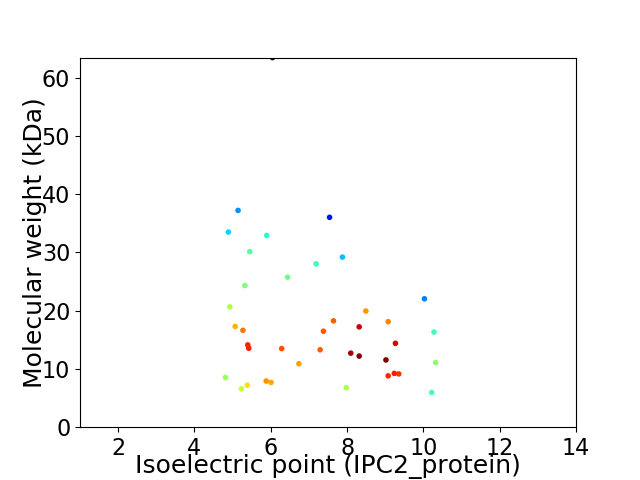
Virtual 2D-PAGE plot for 40 proteins (isoelectric point calculated using IPC2_protein)
Get csv file with sequences according to given criteria:
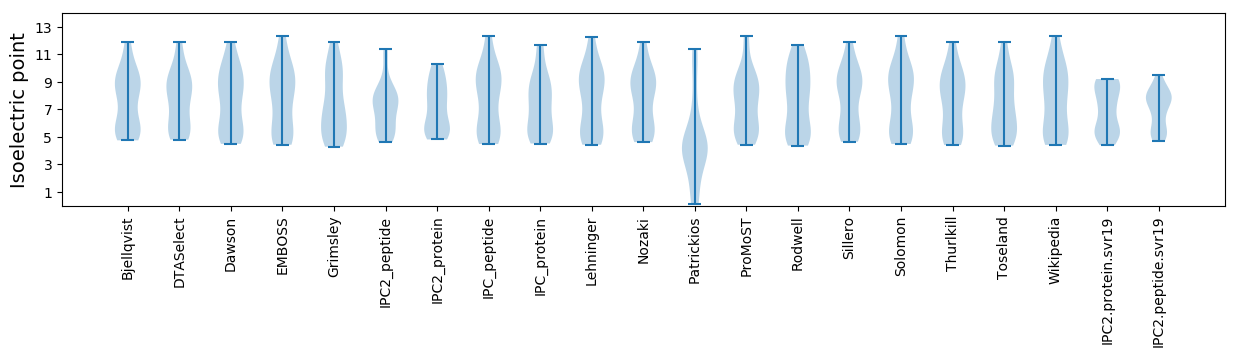
* You can choose from 21 different methods for calculating isoelectric point
Summary statistics related to proteome-wise predictions
Protein with the lowest isoelectric point:
>tr|D9CGA6|D9CGA6_9VIRU Uncharacterized protein OS=Hyperthermophilic Archaeal Virus 1 OX=762905 GN=HAV1_gp37 PE=4 SV=1
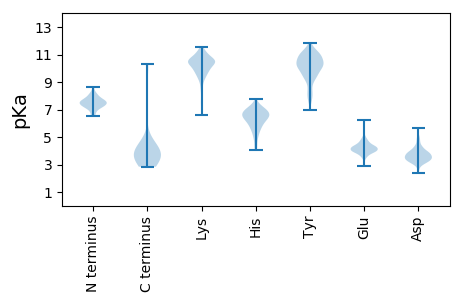
MM1 pKa = 7.27AVVEE5 pKa = 3.99GMYY8 pKa = 10.36YY9 pKa = 11.25GFMAVAAFIGLLLLLLFFASHH30 pKa = 6.72AVLTADD36 pKa = 3.46SMKK39 pKa = 9.68WRR41 pKa = 11.84ALAYY45 pKa = 9.45IVAVFDD51 pKa = 3.17AWFIGAIFGTLSCNEE66 pKa = 3.89VCRR69 pKa = 11.84KK70 pKa = 9.96GGEE73 pKa = 4.17DD74 pKa = 4.94GSAQDD79 pKa = 3.63
MM1 pKa = 7.27AVVEE5 pKa = 3.99GMYY8 pKa = 10.36YY9 pKa = 11.25GFMAVAAFIGLLLLLLFFASHH30 pKa = 6.72AVLTADD36 pKa = 3.46SMKK39 pKa = 9.68WRR41 pKa = 11.84ALAYY45 pKa = 9.45IVAVFDD51 pKa = 3.17AWFIGAIFGTLSCNEE66 pKa = 3.89VCRR69 pKa = 11.84KK70 pKa = 9.96GGEE73 pKa = 4.17DD74 pKa = 4.94GSAQDD79 pKa = 3.63
Molecular weight: 8.53 kDa
Isoelectric point according different methods:
Protein with the highest isoelectric point:
>tr|D9CGA9|D9CGA9_9VIRU Uncharacterized protein OS=Hyperthermophilic Archaeal Virus 1 OX=762905 GN=HAV1_gp40 PE=4 SV=1
MM1 pKa = 7.19MCRR4 pKa = 11.84INLRR8 pKa = 11.84CFFKK12 pKa = 11.14SLWNLLKK19 pKa = 10.6QVGIFIGMIAAVILLAFAVILAIAAVLWFIYY50 pKa = 9.89FITTLDD56 pKa = 3.51PMILVAVVVAFLAYY70 pKa = 8.76VTIASLFRR78 pKa = 11.84KK79 pKa = 7.5QTT81 pKa = 3.24
MM1 pKa = 7.19MCRR4 pKa = 11.84INLRR8 pKa = 11.84CFFKK12 pKa = 11.14SLWNLLKK19 pKa = 10.6QVGIFIGMIAAVILLAFAVILAIAAVLWFIYY50 pKa = 9.89FITTLDD56 pKa = 3.51PMILVAVVVAFLAYY70 pKa = 8.76VTIASLFRR78 pKa = 11.84KK79 pKa = 7.5QTT81 pKa = 3.24
Molecular weight: 9.14 kDa
Isoelectric point according different methods:
Peptides (in silico digests for buttom-up proteomics)
Below you can find in silico digests of the whole proteome with Trypsin, Chymotrypsin, Trypsin+LysC, LysN, ArgC proteases suitable for different mass spec machines.| Try ESI |
 |
|---|
| ChTry ESI |
|
|---|
| ArgC ESI |
|
|---|
| LysN ESI |
|
|---|
| TryLysC ESI |
|
|---|
| Try MALDI |
|
|---|
| ChTry MALDI |
|
|---|
| ArgC MALDI |
|
|---|
| LysN MALDI |
|
|---|
| TryLysC MALDI |
|
|---|
| Try LTQ |
|
|---|
| ChTry LTQ |
|
|---|
| ArgC LTQ |
|
|---|
| LysN LTQ |
|
|---|
| TryLysC LTQ |
|
|---|
| Try MSlow |
|
|---|
| ChTry MSlow |
|
|---|
| ArgC MSlow |
|
|---|
| LysN MSlow |
|
|---|
| TryLysC MSlow |
|
|---|
| Try MShigh |
|
|---|
| ChTry MShigh |
|
|---|
| ArgC MShigh |
|
|---|
| LysN MShigh |
|
|---|
| TryLysC MShigh |
|
|---|
General Statistics
Number of major isoforms |
Number of additional isoforms |
Number of all proteins |
Number of amino acids |
Min. Seq. Length |
Max. Seq. Length |
Avg. Seq. Length |
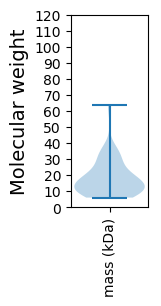
Avg. Mol. Weight |
|---|---|---|---|---|---|---|---|
0 |
6403 |
50 |
585 |
160.1 |
18.21 |
Amino acid frequency
Ala |
Cys |
Asp |
Glu |
Phe |
Gly |
His |
Ile |
Lys |
Leu |
|---|---|---|---|---|---|---|---|---|---|
7.528 ± 0.655 | 1.843 ± 0.223 |
5.06 ± 0.427 | 6.091 ± 0.806 |
4.186 ± 0.284 | 5.279 ± 0.418 |
1.203 ± 0.169 | 7.481 ± 0.533 |
6.31 ± 0.466 | 8.324 ± 0.354 |
Met |
Asn |
Gln |
Pro |
Arg |
Ser |
Thr |
Val |
Trp |
Tyr |
|---|---|---|---|---|---|---|---|---|---|
2.499 ± 0.246 | 3.373 ± 0.318 |
4.529 ± 0.405 | 2.39 ± 0.265 |
5.95 ± 0.511 | 6.95 ± 0.95 |
5.123 ± 0.349 | 8.527 ± 0.479 |
1.609 ± 0.232 | 5.747 ± 0.372 |
Most of the basic statistics you can see at this page can be downloaded from this CSV file
See this proteome in:

Proteome-pI is available under Creative Commons Attribution-NoDerivs license, for more details see here
| Reference: Kozlowski LP. Proteome-pI 2.0: Proteome Isoelectric Point Database Update. Nucleic Acids Res. 2021, doi: 10.1093/nar/gkab944 | Contact: Lukasz P. Kozlowski |